


A Flight to Safety Returns
Shifting geopolitical alliances, richly valued markets, rising U.S. debt, and persistent inflation have investors rebalancing portfolios and seeking safe havens. While the U.S. dollar remains the world’s dominant reserve currency, its status is being tested by growing challenges – from fiscal imbalances, geopolitical shifts, and a global move to diversify reserves.
Today’s “flight to safety” is broader and more complex than in past cycles. Investors are no longer limiting their search to gold or Treasuries alone. Instead, the safety trade now spans digital assets and select high quality dividend-paying equities and consumer staples, as investors seek a blend of protection, liquidity, and real returns amid fiscal and market uncertainty.
The Flight to Safety – and the Dollar’s Waning Grip
The U.S. now faces record debt exceeding $35 trillion, rising interest costs, and persistent inflation, all against a backdrop of multiple geopolitical conflicts. These pressures have eroded confidence in fiat currencies and the stability of U.S. fiscal policy.
For the first time in decades, central banks are actively diversifying away from the dollar, reducing reserve exposure and favoring assets like gold, the yen, and the franc. According to the International Monetary Fund, “the dollar share of global foreign exchange reserves has declined from 65 percent a decade ago to less than 58 percent today,” while central bank gold buying has surged to its highest pace in half a century.
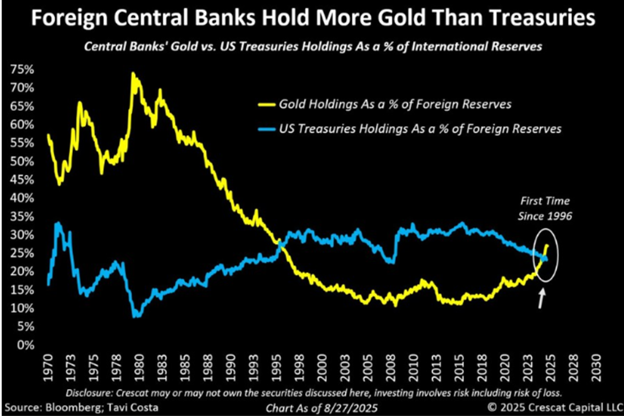
Chart Source: Reuters.com
Countries such as China, Russia, and Turkey have been steadily reducing U.S. Treasury holdings, while simultaneously increasing gold reserves and completing trade settlements in local currencies.
At the same time, the BRICS bloc (a group of major emerging economies including Brazil, Russian, India, China, and South Africa) and other emerging economies are accelerating efforts to settle trades in non-dollar currencies, which is part of a broader movement toward financial independence from U.S. policy influence and sanctions risk.
Still, the dollar’s dominance remains intact for now. U.S. Treasuries continue to represent the world’s most liquid and trusted safe asset, and America’s deep capital markets are unmatched. Yet the trend is clear: the world is quietly hedging against U.S. policy uncertainty and currency concentration risk. For both central banks and individual investors, this shift highlights a growing preference for assets that preserve value rather than chase growth, reshaping what safety means in a changing global order.
The U.S. debt-to-GDP ratio, now above 120%, underscores why confidence in fiscal responsibility is waning. With interest costs projected to surpass defense spending by 2026, investors are beginning to question whether the “risk-free” rate remains truly risk-free.
Gold’s Renewed Role as the Ultimate Store of Value
Gold’s recent resurgence reflects the changing monetary environment reflecting the idea that, when confidence in fiat currency wanes, investors return to tangible stores of value. In 2024, central banks purchased 1,044.6 metric tons of gold – the third year in a row that gold purchases surpassed the 1,000 metric ton mark, echoing the behavior seen during the 1970s inflation spike and the 2008 financial crisis.
This renewed accumulation is not just about diversification; it’s about independence. For emerging-market central banks, holding gold reduces the risk of sanctions, while providing a universally recognized store of wealth that can’t be frozen or devalued by policy.
Gold’s appeal lies in its timeless qualities: it is scarce, unobstructed by credit risk and less influenced by political factors than fiat currencies. Alongside gold, U.S. Treasuries, the Swiss franc, and the Japanese yen remain trusted hedges, each benefiting from deep liquidity, credibility, and perceived neutrality in turbulent times.
While gold offers no yield, it has historically helped diversify portfolios and preserve purchasing power during inflationary or geopolitical shocks. Silver and platinum have also benefited from this flight to tangible value, blending precious metal scarcity with industrial demand themes in clean energy and technology sectors.
The Digital Dimension: Bitcoin and New-Age Havens
Some investors now view Bitcoin as a complementary store of value as it is decentralized, limited in supply, and increasingly accepted by institutions. While it doesn’t replace traditional havens, it has emerged as a new accessible alternative available to investors of all types. Over the past few years, we’ve seen Bitcoin move from a speculative asset to institutional adoptions from major asset managers such as BlackRock and Fidelity. This legitimization has also been reflected within government policy from emerging markets to advanced economies like the U.S. and the E.U. with the acceptance of spot Bitcoin ETFs and experimenting with central bank digital currencies. However, Bitcoin remains volatile due to its perceived value, limited history, government regulation, in addition to supply and demand dynamics. Multiple avenues to gain access to virtual currencies, global liquidity and accessibility have helped increase retail and institutional investors’ adoption as a potential hedge.
More traditional defensive equity sectors such as consumer staples, healthcare, and reliable dividend-paying stocks continue to offer income, stability and modest growth, appealing to investors seeking consistent returns amid volatility. While there is no universal approach to determining the right level of exposure to new-age havens, the key is to maintain thoughtful diversification while ensuring each allocation aligns with the portfolio’s long-term objectives, time horizon, and risk tolerance.
Implications for Investors
A weaker dollar has historically provided a strong tailwind for real/alternative assets, commodities, and foreign holdings, which are typically priced in dollars. When the dollar declines, international buyers can purchase these assets more cheaply, boosting demand and pushing prices higher. Combined with economic and fiscal uncertainties domestically, we’ve seen investors flock to these assets throughout 2025.
Recent Historical examples illustrate this pattern:
Early 2000s (2002–2008): Following the dot-com bust and a series of rate cuts, the dollar weakened sharply. During this period, gold tripled in value, oil surged from around $20 to over $100 per barrel, as broad commodity indices such as the CRB Index also rallied, driven by global demand and a favorable currency backdrop.
Post-2020: Bitcoin soared over 300% in 2020 and U.S. equities rallied from a reopening of the global economy as fiscal stimulus was pumped into financial systems. As a result, inflation ran away, hitting 9.1% in June of 2022. The dollar retreated from its pandemic-era highs, while gold, silver, and energy commodities rallied once again—reflecting both inflation concerns and a global move to diversify away from fiat currencies.
Beyond real assets, a weaker dollar also amplifies foreign corporate earnings when translated back into U.S. dollars. For multinational firms based outside the U.S., overseas revenues become more valuable in dollar terms, improving profitability and often lifting share prices of international equity funds and ADRs (American Depositary Receipts).
For investors, this reinforces the value of diversifying beyond U.S.-only exposure, as a weakening dollar can serve as a tailwind for non-U.S. assets. Historically, periods of dollar decline have coincided with outperformance in international and emerging-market equities, as well as commodities and real assets that benefit from stronger global demand.
At the same time, traditional safe havens such as gold, foreign currencies and high-quality sovereign bonds continue to play an essential stabilizing role, while select digital assets—most notably Bitcoin—are emerging as complementary stores of value in an increasingly decentralized financial system. Defensive equity sectors like consumer staples, healthcare, and utilities remain reliable anchors for income and capital preservation both domestic and international.
Adapting to a Multipolar Monetary Future
With volatility stemming from fiscal uncertainties, geo-political pressures, inflation and stretched equity valuations, it’s imperative that investors take an honest look at their portfolios and ensure they are properly diversified to hedge against potential market disruptions. This modern flight to safety looks both familiar and new – spanning gold, foreign currencies, U.S. Treasuries, non-US securities, dividend paying equities, and a growing class of digital and alternative assets that reflect the evolving nature of global finance.
While no asset is completely free of risk, Weatherly helps clients find the right balance between opportunity and protection. Because each client’s goals and circumstances are unique, we take a personalized, planning-driven approach—ensuring portfolios are thoughtfully positioned to weather any market environment. At Weatherly, we’ve been working with our clients to ensure portfolios remain balanced and diversified across their equity and fixed income sleeves while targeting a neutral asset allocation. With strong domestic equity returns over the past years, we are taking this opportunity to work with clients on shaving equity positions, charitable gifting and tax-conscious risk reduction strategies. Our team is here to talk through your portfolio to ensure your financial plans remain on track for whatever tomorrow brings.
Sources:
https://www.visualcapitalist.com/sp/charted-a-decade-of-central-bank-gold-purchases/
*Disclosures:* The information provided should not be interpreted as a recommendation, no aspects of your individual financial situation were considered. Always consult a financial professional before implementing any strategies derived from the information above.
Blog content is human-generated by the Weatherly team members. AI was used to assist with generating titles and subtitles.
Every time you fill up your gas tank, flip on the light switch, or check your email on your smartphone you are directly interacting with the world of commodities. Commodities are the essential raw goods and materials that are the center of virtually every aspect of our daily lives. But what exactly constitutes a commodity and why do they play such a crucial role in our everyday lives and in the global economy? In this blog post, we introduce the world of commodities by defining the major categories, providing historical background, and exploring the current state of the market to better understand the dynamics impacting everyday life.
Defining Commodities:
Within the world of commodities, there are three main broad categories which include agriculture, energy, and metals. Within each category we can dive deeper into subcategories that we probably interact with daily. Below we provide some examples of items that make up each category, but please note this is not an exhaustive list:
Agricultural Commodities:
Agricultural commodities are the raw materials primarily derived from farming, ranching, or other agricultural activities. These items are produced for trade or consumption and are often inputs to other goods and products. Some examples of agricultural items include:
- Seed Oils: canola oil, soybean oil, olive oil
- Cereal Grains: wheat, corn, rice, oats
- Livestock: cattle, poultry, pork
- Dairy: milk, butter, cheese
- Soft Commodities: cocoa, coffee, sugar
Energy:
Energy commodities consist of fuels and natural resources used to produce energy and power transportation, industry, and various aspects of modern day-to-day life. Energy is perhaps one of the most important commodities because the cost of energy directly affects the cost of virtually everything we consume from groceries, consumer electronics, clothes and more. This type of commodity can be broadly defined using two categories – renewable and non-renewable energy. Some examples include:
- Non-Renewable Energy: natural gas: coal, nuclear energy, petroleum products
- Renewable Energy: solar, geothermal, wind, hydropower
Metals:
Metals are another important category of the commodities sector and consist of raw materials harvested from the Earth that serve a variety of purposes from industrial production, construction, and as inputs to electronic devices. This sector has become more important recently with the focus on electric vehicles and the rise of AI which has in turn increased demand for what are referred to as rare earth metals. Metals can be divided into two broad categories:
- Precious Metals: gold, silver, platinum, iridium
- Industrial Metals: copper, aluminum, nickel, lead, rare earth metals
With the importance commodities play in our everyday lives, it is important to reflect on the impact commodities have had on the human experience historically, which can help us better understand today’s world.
History:
Agricultural Commodities:
The human species is and for much of our history we have operated as nomadic hunter gatherers – scavenging in the wild for various plants and animals while rarely staying in one place. The earliest signs of agricultural production dates to 11,000 BCE when a slow transition away from the hunter gather lifestyle took place and is believed to have occurred independently in areas such as northern China, Central America, and the Fertile Crescent. By 6,000 BCE most animals that we are familiar with today had been domesticated and used as livestock, and by 5,000 BCE there was evidence of farming on all the continents except for Australia.
Agricultural production was largely localized at the beginning, but as time progressed early civilizations began venturing out to discover other parts of the world and trade amongst each other. Early signs of agricultural trade can be seen through Mesopotamia and Ancient Egypt, Mediterranean civilizations such as the Phoenicians and Greece, and even amongst ancient Polynesians and Pacific Islanders over vast distances. More formalized agricultural markets were later developed by the Romans and Medieval England, especially for grains. The discovery of North America led to a whole new world of agricultural products in abundance such as maize (corn), tobacco, peppers, pineapple, papaya, avocados, cacao (chocolate) and more. With the discovery of these new crops, conflicts arose amongst the great powers of the time, namely England, Spain, Portugal, and France.
Jumping forward in history, a transformative period took place in the United States that would dramatically change the commodities markets with the establishment of the Chicago Board of Trade (CBOT) in 1848. With the CBOT, the first futures contracts for crops were established. These contracts allowed farmers and merchants to establish predictable prices for their crops and hedge against price risk. Futures contracts would go on to include a wide variety of products and would help establish a more predictable and stable global trade environment, a system that we use to this very day. Lastly, during the 20th century came technological advancements that boosted the production of agriculture worldwide, especially with the invention of fertilizers, and would lead to lower prices and increased food security worldwide.
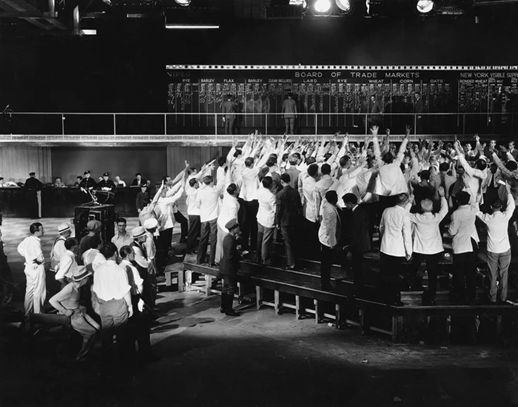
Image Source: https://blog.ampglobal.com/history-of-futures
Energy/Oil Production:
Energy production as we know it today is a relatively new phenomenon in the context of human history. It was not until the 18th century, with the invention of the steam engine, that modern energy use as we know it today was created. At the time, coal was the primary input for energy production, which would lead to radical changes in transportation and help pave the way for the industrial revolution. As time went on coal became an environmental concern and alternative sources of energy were sought out, leading to the eventual shift from coal to oil.
The first evidence of oil discovery goes back to 600 BCE in China where oil was transported in pipelines made of bamboo. However, real commercial use of the substance originated in the United States in the mid 1800’s and early 1900’s with the discovery of oil in Pennsylvania and later in Texas with the first formal oil well being established by the Rock Oil Company in Titusville, Pennsylvania. Petroleum would prove to be much more flexible and adaptable than coal and other forms of oils such as whale oil. As technology advanced with the invention of cars and the light bulb, oil became the preferred energy source and demand exploded. During World War I, oil would become one of the most valuable commodities in the world, proving itself not only as an important source of energy but as a critical military asset, incentivizing regions around the world to develop their own supplies.
One of the most transformative moments for the oil industry came in 1938 with the discovery of oil in Saudi Arabia and surrounding areas. At the onset of the discovery, colonial powers such as England attempted to assert control of oil production in the region but were eventually pushed out for both economic and geopolitical reasons, leading to home countries taking control of production. To signify their authority, in 1960 the Organization of the Petroleum Exporting Countries, or OPEC, was established and includes countries such as Iran, Iraq, Kuwait, Saudi Arabia and others. OPEC was established to coordinate oil production between the member countries and to this day collectively influences oil prices and continues to be a major geo-political player.
In terms of oil production, historically speaking, the United States has been the dominant producer for decades but over the years other countries such as Saudi Arabia have competed for the lead.
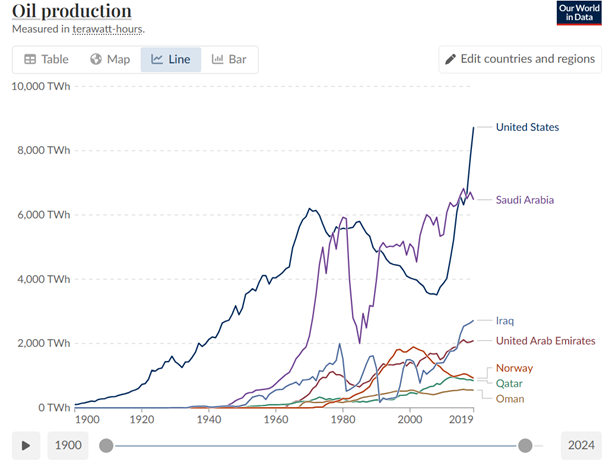
Chart Source: https://ektinteractive.com/history-of-oil/
Although oil remains the dominant source of energy, new sources of energy harvesting have been coming online in recent years as technology has advanced. Examples include solar, wind, hydropower, and geothermal power. Additionally, although not necessarily new, recent developments such as the rise of artificial intelligence has breathed new life into nuclear energy production as a form of clean energy.
Metals:
Metals have played an integral role in human history so much so that entire eras are associated with them, for example, the stone age, bronze age, and iron age. One of the first metals discovered and used by humans around 9000 BCE was copper. Metals such as gold, silver, tin, lead, and iron were also used in pre-historic times. At first, metals were primarily used as tools for farming, in pottery, and as weapons but as time went on and metal working techniques advanced, they became integral in constructing structures and fortifications. Additionally, precious metals such as gold and silver were widely used as currency and stores of value which continues to this day. In fact, the first evidence of precious metals being used as currency go back to 600 BCE in modern day Turkey with round coins made of silver. While gold and silver remain widely recognized as some of the most valuable metals around, in today’s industrial world, there is perhaps no metal more important that steel which is the bedrock of modern-day society and is one of the most traded commodities.
The evolution of the steel industry traces its roots back to Ancient India and China where rudimentary steel making began. India and China are also responsible for beginning what would later become a global industry by initiating trade in the ancient world with evidence of steel swords in Damascus having originated in India, and Romans referring to China as the best source of steel in the world. Early on, much of the demand for steel was driven by warfare with imperial armies in Greece, Persia, Rome, and China prioritizing the metal for its strong and durable properties.
For many centuries, steel was considered a luxury or a niche metal, but that all changed as the 18th and 19th century saw rise to the industrial revolution with steel being preferred for various products and structures from tools, pipes, and bridges. Later, new techniques were established in England that would allow for the mass production of steel at competitive prices, giving rise to skyscrapers and transitioning ships from iron. England was the predominant producer of steel in the world until the late 19th century when America overtook them largely attributed to Andrew Carnegie and the Carnegie Steel Company. During the 20th century with the outbreak of World War I and World War II, steel would become a critical military asset used in the production of a wide variety of equipment, especially tanks. Following the end of World War II, steel production would pivot from military applications to consumer products and infrastructure. Steel would also bring nations together in economic alliances with a famous example occurring in the 1950’s with the establishment of the European Coal and Steel Community (ECSC) which at the time included West Germany, France, and Italy. The ECSC was developed to promote free movement of products within Europe and would set the stage for the eventual creation of the European Union.
The steel industry would go on to evolve dramatically in terms of production. According to the World Steel Organization, in 1967 the US, Western Europe, and Japan accounted for 61.9% of global steel production. However, with the rise of emerging economies, by 2000 the share of steel production in the US, Europe, and Japan fell to 43.8% and by 2011, emerging economies accounted for 70% of steel production with China representing 45% of production globally. This shift was mainly due to these emerging economies industrializing and building out infrastructure and is expected to continue with increased development in Southeast Asia, the Middle East, and North Africa.

Image Source: https://www.ironworkers477.org/news-details/webview/history/single/16722
The history of commodities provides us with the context we need to understand where commodities come from, how markets have evolved, and helps us to understand the world around us. The state of the commodities markets is continually evolving, and we will explore general trends to be aware of moving forward.
Commodity Trends in 2025:
There is no shortage of news revolving around trade negotiations, geopolitical tensions, and changing market dynamics in 2025. Given these changing dynamics it is important to highlight new trends and forecasts within the world of commodities. Within this section we explore these changes as provided by the April 2025 Commodity Markets Outlook developed by the World Bank Group. Please note these outlooks do not necessarily reflect Weatherly’s views.
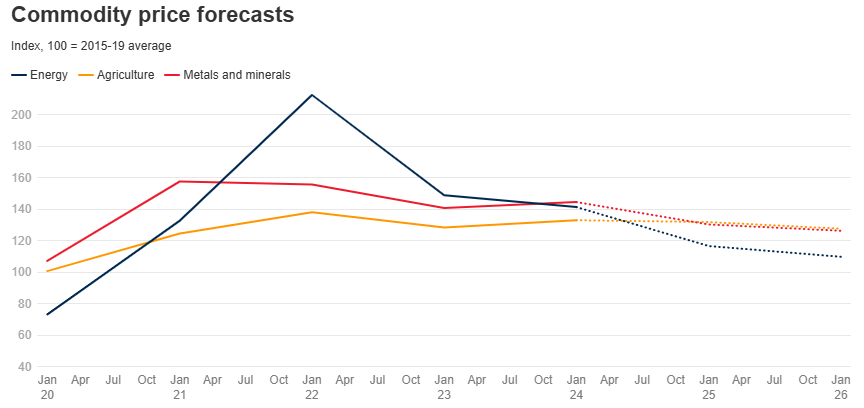
Chart Source: https://blogs.worldbank.org/en/developmenttalk/the-commodity-markets-outlook-in-eight-charts1
Agriculture:
Agricultural commodity prices are mostly expected to fall in 2025 and 2026 stemming from a variety of factors. First, there is ample supply and improving harvests amongst items such as maize (corn), wheat, rice, and soybeans with easing trade restrictions, for example with rice exports from India. However, items such as cocoa and coffee have seen their prices increase mainly due to the impacts of weather in areas such as Brazil and West Africa, which are widely expected to subside going into 2026. As a result, speaking on the industry more broadly, farmers are seeing prices for their crops fall just as the input costs to produce those crops have increased. The main area of concern is the increased cost of fertilizers where prices have remained volatile due to supply disruptions stemming from geopolitical tensions. Other factors like slowing global growth and uncertainty regarding trade policy are also forecasted to push commodity prices lower.
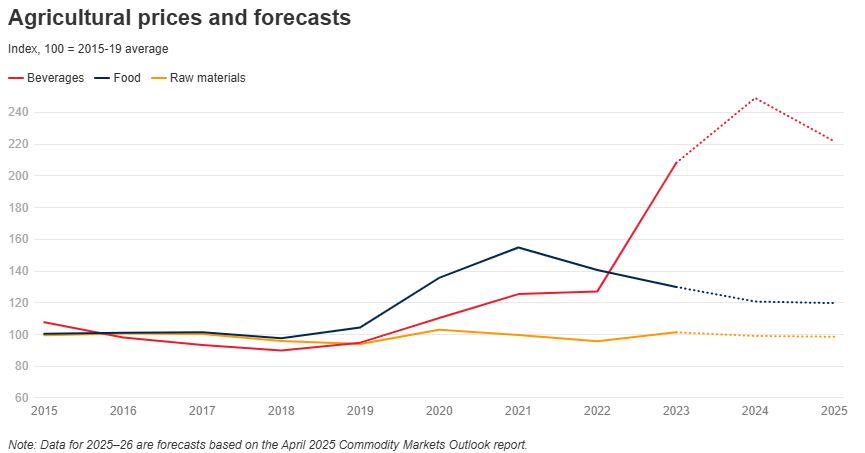
Chart Source: https://blogs.worldbank.org/en/developmenttalk/the-commodity-markets-outlook-in-eight-charts1
Energy:
Within the energy sector, prices are also expected to fall in 2025 and 2026. The World Bank reports cites that the forecasted average price per barrel of brent crude will hover around $64/barrel in 2025 and $60/barrel in 2026. One of the trends effecting this drop in price stems from increased production among OPEC+ countries along with increased production from other countries including Brazil and Canada. This increase in supply is coming at a time of uncertainty for the global economy as the forecast is for slower growth moving forward. Other factors effecting the price of oil include the electrification of cars, a drop in demand from China, and the expansion of renewable energy sources.
Metals:
Prices for metals are also expected to decline in 2025 and 2026 after a modest increase in 2024. Some of the same themes that are playing out in the energy and agricultural markets are also present in the metals sector, such as the forecast for slower global growth. For metals, this is especially notable in China as demand there is expected to decline due to weakness in their real estate sector, a slowdown of domestic demand in China, along with uncertainty in trade policies. More broadly, the World Bank cites a slowdown in industrial activity and manufacturing worldwide as a cause of the drop in prices. However, with the increase in electric car demand, the rise of AI utilization, and other advanced technologies, the demand for what are referred to as rare earth metals is projected to rise significantly in 2025. Some of these rare earth metals include materials such as neodymium, dysprosium, and praseodymium.
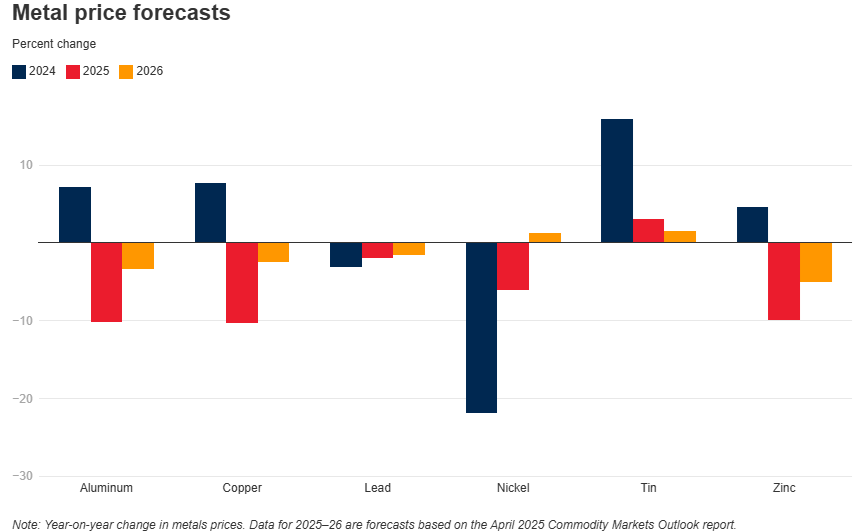
Chart Source: https://blogs.worldbank.org/en/developmenttalk/the-commodity-markets-outlook-in-eight-charts1
Risks:
We would like to note that there are risks to this forecast provided by the World Bank. Risks include changing trade policies, increased geopolitical tensions, and changes in the global economy. Although prices are forecasted to fall, we would note that the dynamic nature of the global economy can alter these forecasts moving forward.
Commodities and Your Portfolio
With no shortage of news worldwide, whether that be ongoing trade negotiations, tariff impacts, or geopolitical tensions, Weatherly continuously monitors how these events will impact client portfolios. Our team of investment professionals are working closely with clients to ensure that their portfolio’s asset allocation levels are in-line with their financial goals and overall risk tolerance while also implementing proper diversification across client accounts. We continue to monitor which sectors of the economy may be affected by changes in policy and changing economic trends. Additionally, we continue to leverage our experience with holistic financial planning to assist our clients with developing a road map for their future while implementing stress tests and alternative scenarios to provide our clients with options and peace of mind. Our team is here to serve you and discuss your portfolio and help you establish a sound plan to navigate the ever-changing landscape of the investment world.
Sources:
https://ektinteractive.com/history-of-oil/
https://farms.extension.wisc.edu/articles/a-brief-history-of-grain-markets/
https://foodsystemprimer.org/production/history-of-agriculture
https://worldsteel.org/about-steel/steel-story/#steel-industry-today-and-future-developments
https://blogs.worldbank.org/en/developmenttalk/the-commodity-markets-outlook-in-eight-charts1
https://humanorigins.si.edu/evidence/human-fossils/species/homo-sapiens
*Disclosures:* The information provided should not be interpreted as a recommendation, no aspects of your individual financial situation were considered. Always consult a financial professional before implementing any strategies derived from the information above.
Blog content is human-generated by the Weatherly team members. AI was used to assist with generating titles and subtitles.
For many investors, the federal deficit represents an intangible,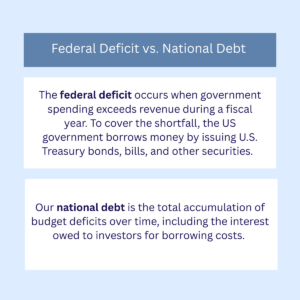 distant issue that reflects more about Washington politics than personal finance. As wealth managers, we know the size and trajectory of the U.S. deficit can influence market conditions, interest rates, and ultimately our client’s long-term financial plans. As we help clients plan for retirement, manage portfolios, and consider estate or tax strategies- it’s important to understand how macroeconomic factors, like the deficit, shape our environment.
I. The Federal Deficit Over Time
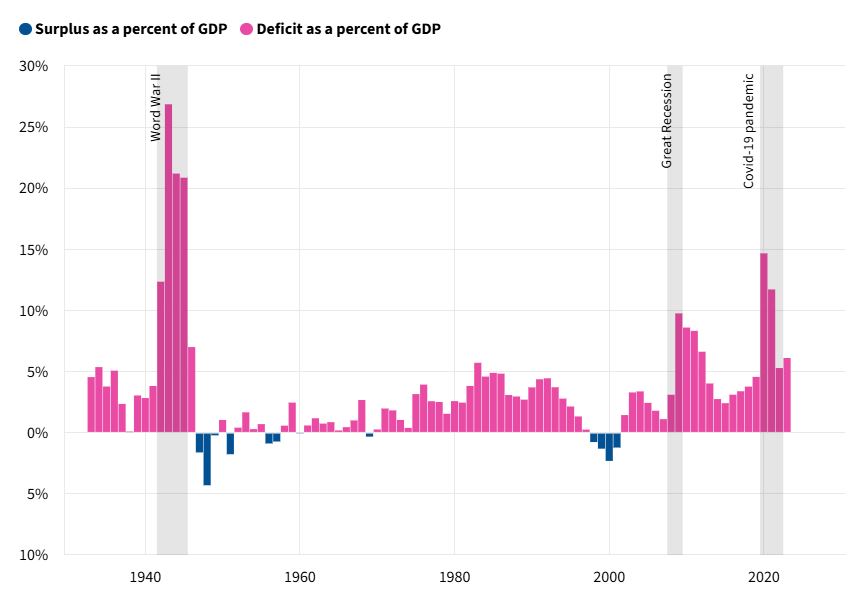
One way to understand the federal deficit is by comparing it to our GDP, which is the overall size of the U.S. economy. Expressing the deficit as a percentage of GDP accounts for inflation and allows for more meaningful comparisons year over year. Since World War II, the deficit has moved in cycles with notable surges during wartime spending and recessionary periods. Historically, deficits widen during recessions and narrow during periods of economic growth.
Notable moments in U.S. budget history began with World War II, which triggered the largest federal deficit on record as a percentage of GDP. In 1943, the deficit totaled $55 billion, or 26.9% of GDP, as the government financed massive military spending through war bonds and increased income taxes.
The Great Recession of 2008 caused the deficit to balloon to $1.4 Trillion in 2009 (9.8% of GDP) due to stimulus spending, bailouts, and falling tax revenues. Although costly, the stimulus efforts are credited with stabilizing the economy and preventing a deeper recession.
Most recently, the COVID-19 Pandemic of 2020 saw the second-largest deficit in US History, behind WWII on a percentage of GDP basis. The deficit reached $3.1 Trillion (14.7% of GDP) in 2020. Significantly increased government spending included enhanced unemployment benefits, direct payments to individuals, and Paycheck Protection Program (PPP) loans.

Exploring 2023 Further
Recently, we have seen a reversal of the historical patterns explored above. In 2023, despite a growing economy and relative peacetime, the U.S. deficit reached approximately 6.1% of GDP- a significant shortfall by historical standards.
Deficits are driven by two main components: a decline in federal revenue and an increase in government spending. Federal revenue dropped sharply in 2023, primarily due to a decrease in capital gains tax collections following the stock market downturn in 2022. On the other side of the equation, federal spending rose substantially. A large portion of this spending falls under non-discretionary programs (such as Social Security, Medicare, veterans’ benefits, and unemployment insurance) which will continue to grow as our population ages and healthcare costs rise.
To better understand this dynamic, the two charts below illustrate the trends in federal revenue and expenditures from 2019 to 2024, highlighting the widening gap between what the government collects and what it spends. 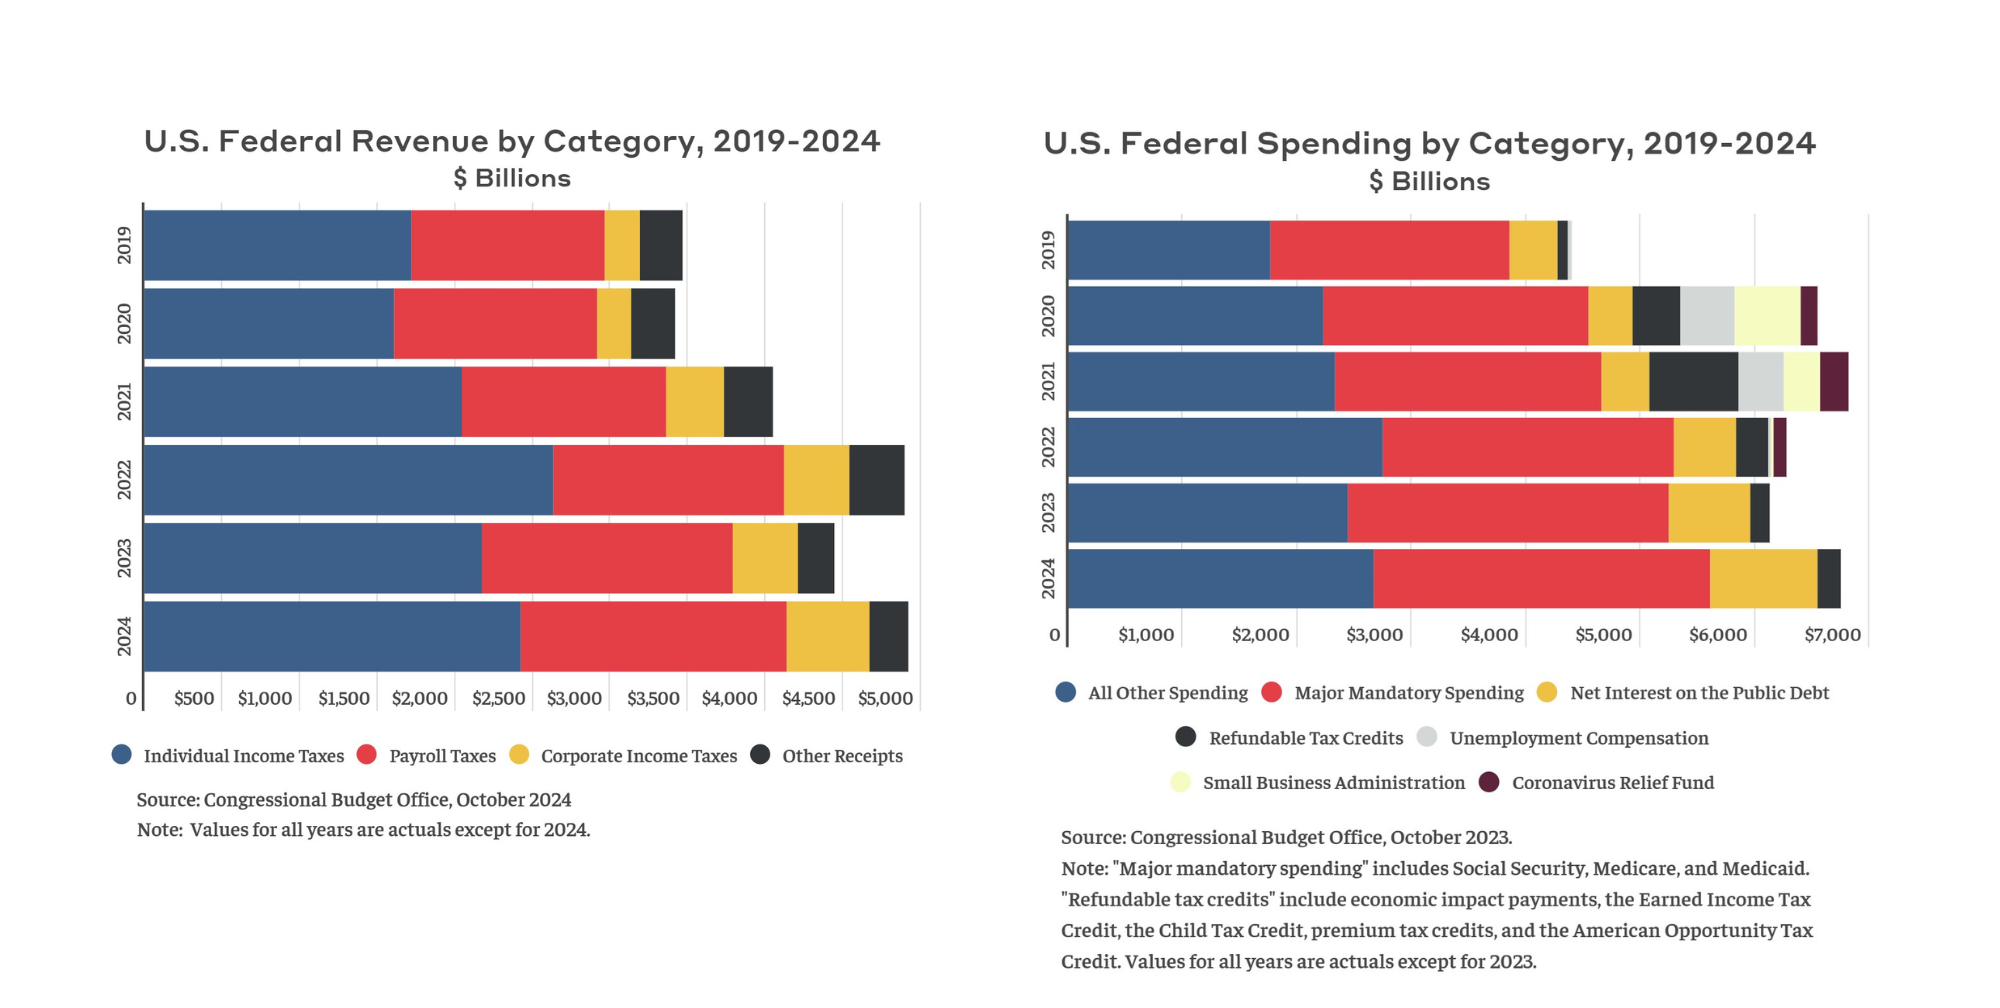
Today’s Numbers
As of fiscal year 2025, the federal deficit stands at approximately $3.57 trillion. This marks a 9.7% increase from the same period last year (October 2023–March 2024), when spending totaled $3.25 trillion. The $315 billion increase reflects continued growth in mandatory programs such as Social Security, Medicare, and Medicaid, along with rising interest payments on the national debt- all of which are outpacing federal revenue. To help bridge this fiscal shortfall, the U.S. government raises funds by issuing Treasury securities, which are sold at auction to investors around the world.

II. Short Term Sustainability: How the Government Borrows
When the U.S. government runs a deficit, it must borrow money to cover the gap between spending and revenue. This balancing act is managed by the U.S. Department of the Treasury, which raises funds by issuing debt securities known as Treasuries. These securities come in various forms: Bills (T-Bills), Notes, and Bonds, each with different maturities and interest rates.
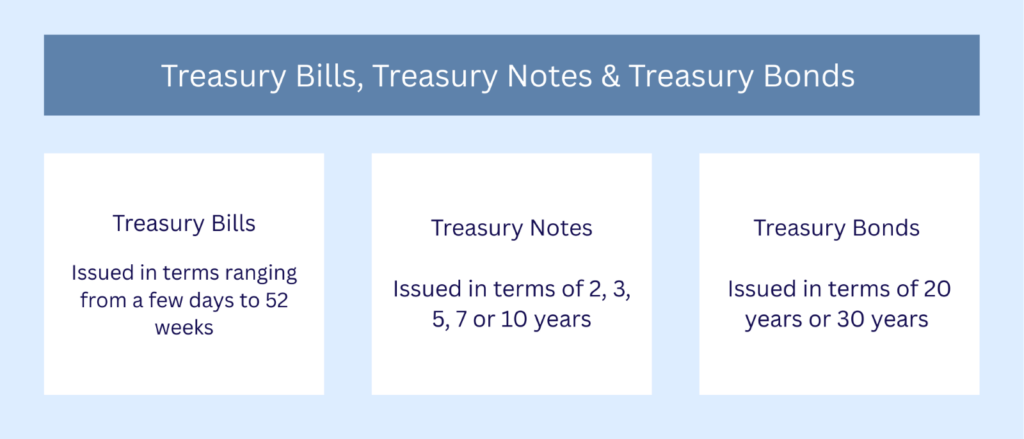
These new issues are offered through public auctions which are held throughout the year. The process involves large institutions, fund companies, foreign governments, and others- submitting bids which ultimately set interest rates based on demand. These securities are awarded to successful bidders and trade further in the secondary markets.
Historically, there has been strong and consistent demand for U.S. Treasury securities, which are backed by the “full faith and credit” of the United States (the world’s largest economy). This trust, combined with the U.S. dollar’s status as the global reserve currency, has positioned Treasuries as one of the safest and most reliable investments worldwide. Foreign governments, central banks, and global institutions routinely purchase U.S. debt not only for portfolio stability and investment income, but also to hold as reserves, reinforcing their own economic security.
III. Long Term Impact: Taxes and Interest Rates
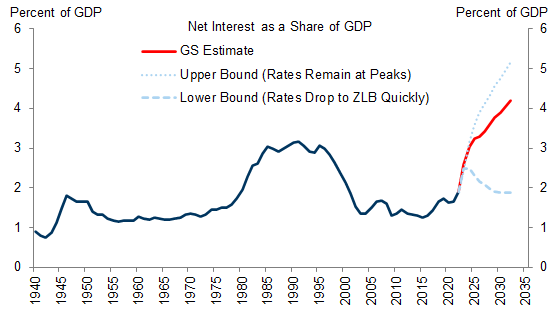
The U.S. federal budget will likely remain a pressure point in the years ahead, drawing attention from policymakers, economists, and investors. While running a fiscal deficit has become the norm in recent decades, net interest expense has remained relatively manageable when measured against the size of the U.S. economy (GDP). However, this balance is sensitive to interest rate changes. If interest rates fall, borrowing costs for the government decrease. But if rates remain elevated for longer, the cost of servicing the debt grows (see chart). Although the U.S. can continue to borrow to finance deficits, a sustained increase in Treasury issuance could impact both investor demand and overall interest rates.
To address the growing deficit, policymakers reach for two levers:
- Decreasing Government Spending
- Increasing Revenue (taxes)
Spending cuts might include program reforms, defense budgets reductions, and limitations on discretionary spending. Each carrying their own economic and social trade-offs. On the other hand, options for boosting revenue involve taxes- raising income through higher corporate, capital gains, or personal income taxes. No one path offers a complete solution and policy changes introduce new challenges and opportunities when planning for our clients. Balancing the budget is a delicate process and nothing demonstrates the complexity like the online resource Build Your Own Tax Extensions Calculator. If you want to learn more about the history, we have explored A Presidential Look at U.S. Taxes in a prior Weatherly blog post.
How WAM Can Help?
The U.S. fiscal budget is far more complex than a single headline number. While a large deficit may appear daunting, it can also present opportunities within the fixed income space. Particularly through increased Treasury issuance, which can offer attractive state and local tax-exempt yields for their investors.
Changes in tax policy tied to the deficit open the door to new strategies in estate planning and gifting. As the fiscal landscape evolves, we encourage you to reach out to your Weatherly advisory team to ensure your investment allocation, long-term goals, and financial plan remain aligned with current opportunities and challenges.
*Disclosures:* The information provided should not be interpreted as a recommendation, no aspects of your individual financial situation were considered. Always consult a financial professional before implementing any strategies derived from the information above.
Blog content is human-generated by the Weatherly team members. AI was used to assist with generating titles and subtitles.
Over the past few years Artificial Intelligence (AI) has become a hot topic commanding the world’s attention. Although the field of AI research began in the 1950s, many consider us to be in an AI renaissance. The excitement around AI has ignited a gold rush mentality, driving unprecedented levels of investment into the AI sector. However, amidst the excitement and promise, it’s important to wade through the hype and identify true opportunities.
Key AI Trends
With public interest in AI being at an all-time high, people are eager to experience and benefit from AI powered systems. This high demand has helped the AI landscape evolve rapidly, with new advancements and applications being released daily. Some of the most prominent real-world AI trends currently driving the industry are:
- Generative AI: Arguably the hottest trend with models like ChatGPT and Midjourney capturing the public’s attention. Generative AI programs are defined by being able to create new content from human prompts. The most common content created with Generative AI is text and images, however, new generative programs are able to create music, code, and even video content.
- Multimodal AI: This is the ability of AI models to process and understand multiple forms of data (text, images, audio, video, etc.) This trend is leading to a deeper understanding of content and more human-like interactions.
- AI for Good: There is a growing emphasis on using AI to have a social impact by addressing global challenges such as climate change, healthcare, and education. This can include Ethical AI which prioritizes developing AI systems that are fair, unbiased, transparent, and accessible.
- AI in the Enterprise: Enterprise AI strives to create operational efficiency by automating routine tasks and optimizing processes. Many companies are working towards embracing Enterprise AI to create an augmented workforce where AI is used as a tool to enhance human capabilities rather than replace.
Understanding the AI Landscape
Although AI was born nearly 70 years ago, its recent boom in popularity has the whole world talking about it. AI has become a trending topic, and with companies slapping the “AI” label on nearly everything, it can create a distorted picture of the market, making it difficult to differentiate between genuine invocation and overhyped promises. The AI landscape is a complex ecosystem, and in order to make informed decisions, it’s crucial to understand some of the components essential to any AI value chain.
- Infrastructure: The software and hardware necessary to power AI applications. This includes high- performance computing systems, data centers, and chips.
- Data Management and Analytics: High volumes of quality data are the fuel for AI. Accessing, handling, and extracting insights from vast datasets is crucial for AI’s success.
- Algorithms: These are the core of AI systems. Developing cutting-edge algorithms is a key area of focus for many AI companies. Some recent breakthroughs include deep learning, reinforcement learning, and generative models.
- Applications: This encompasses the end products and services powered by AI. AI driven solutions span across various sectors. Some real- world applications include healthcare, finance, transportation, and customer service.
Investing in AI
Key Considerations
When considering investments in AI, it’s important to focus on several key areas:
- Scalability: The ability of a company’s AI solutions to scale effectively as demand grows is crucial for long-term success.
- Data Management: Effective data management practices are vital, as the quality and volume of data directly impact the performance of AI systems. Good data in equals good data out.
- Cost: The cost of developing and implementing AI technologies can be high. Investors should assess whether companies have a sustainable financial model.
- Talent Recruitment/Retention: The competitive landscape for AI talent is intense. Companies that can attract and retain top talent will have a strategic advantage.
Challenges
Despite the immense potential, investing in AI comes with its own set of challenges:
- Overvaluation: The hype around AI can lead to inflated valuations. Investors should be wary of overpaying for companies with unproven technologies or track records.
- Regulatory Risks: The regulatory environment for AI is still evolving. Companies may face significant hurdles related to data privacy, security, and ethical considerations.
- Ethical Concerns: As AI technologies become more prevalent, ethical considerations around bias, fairness, and transparency become increasingly important.
Navigating the AI Investment landscape requires a careful balance of enthusiasm and skepticism. By focusing on genuine opportunities and understanding the inherent risks, investors can position themselves to benefit from the transformative potential of AI.
AI’s Broader Impact
Economic Growth
AI’s impact on economic growth is profound, with predictions estimating its contribution to be up to $15.7 trillion to the global economy by 2030. This staggering figure likely surpasses the combined current output of China and India, driven significantly by $6.6 trillion worth of enhanced productivity and consumer demand from AI-based products and services. (Sizing the prize (pwc.com))
Job Market Transformation
The job landscape is set for a major transformation due to AI, affecting almost 40% of jobs globally. This shift will require carefully balanced policies to manage the transition effectively, ensuring that workforce disruptions are minimized while new opportunities are created.
Investment Surge
The flow of investments into AI development is robust, reflecting its perceived high value and potential to disrupt various industries. This surge underscores the crucial need for investors to identify genuine opportunities and avoid fleeting trends.
Beyond Economic Impact
AI’s influence stretches beyond economic factors to affect national security, politics, and culture, establishing its role as a transformative force across all societal facets.
Identifying Real Opportunities in AI Investments
Investors are urged to focus on sectors where AI could cause significant disruption. Notable areas include healthcare, finance, transportation and logistics, manufacturing, and retail.
- Healthcare
- Disruption: AI can significantly enhance diagnostic accuracy, predict patient outcomes, and personalize treatment plans.
- Profitability: Investing in AI-driven healthcare startups and companies focusing on AI-based diagnostics tools and personalized medicine can lead to substantial returns as these technologies become standard in medical practice.
- Finance
- Disruption: AI is transforming finance through fraud detection, algorithmic trading, personalized financial planning, and Risk Management.
- Profitability: The use of AI to improve fraud detection can lead to reduced financial losses and increased customer trust, while Algorithmic trading enhances trading efficiency, and AI tools are able to enhance risk assessment by analyzing various risk factors and predict potential issues to help institutions make informed decisions.
- Transportation and Logistics
- Disruption: AI optimizes route planning, autonomous vehicles, and predictive maintenance.
- Profitability: Companies developing AI for autonomous driving and logistics optimization like self-driving truck startups and AI-based fleet management systems, offer promising investment opportunities.
- Manufacturing
- Disruption: AI-driven automation improves production efficiency, quality control and predictive maintenance.
- Profitability: Investing in AI firms specializing in industrial automation and robotics can be lucrative as manufacturers adopt AI to enhance productivity and reduce costs
- Retail:
- Disruption: AI enhances customer experience through personalized shopping, inventory management, and sales forecasting.
- Profitability: Investing in retail companies leveraging AI for customer analytics and supply chain optimization can be highly profitable as they gain a competitive edge in the market.
Risks and Challenges in AI Investments
The emerging nature of AI technology brings with it risks such as algorithmic bias and data privacy issues. Investors must conduct thorough due diligence to sidestep investments in overhyped “fake AI” or “AI washing.” This refers to the practice where companies claim to use AI technologies to boost their appeal and attract investment, but they lack the substantial AI capabilities to back these claims.
Investment Strategies for AI
A strategic approach to AI investment involves a blend of short-term tactical moves and long-term vision. This includes staying vigilant of AI advancements and learning from both triumphs and failures within the AI sector.
Energy Intensity of AI
While AI offers significant benefits, it is also energy intensive. Training large AI models requires substantial computational power, leading to high energy consumption. For instance, data centers housing AI systems consume vast amounts of electricity, contributing to the carbon footprint of AI technologies. Efforts are being made to develop more energy-efficient AI algorithms and use renewable energy sources to power data centers, aiming to mitigate the environmental impact of AI.
Conclusion
AI has undeniably captured the world’s attention. With every passing day, we witness groundbreaking advancements. From self-driving cars to medical innovations, the potential applications of AI are seemingly limitless. However, amidst the excitement and promise, it is crucial to navigate the hype and identify genuine opportunities. Navigating the AI investment landscape requires a balanced approach of enthusiasm and caution. With a deep understanding of AI’s technological underpinnings, legal considerations, and market readiness, investors can successfully leverage the countless opportunities presented by this dynamic technology. Through our portfolios Weatherly is embracing AI by adding to the sector in diverse ways. We continue to discuss new opportunities and risks as they relate to our individual clients’ accounts and look forward to new advancements in this sector.
** The information provided should not be interpreted as a recommendation, no aspects of your individual financial situation were considered. Always consult a financial professional before implementing any strategies derived from the information above.
We’ve all heard the old cliché “Don’t put all your eggs in one basket,” and that couldn’t be more evident than in the realm of investing. In the field of investing, putting all your eggs in one basket is often referred to as “portfolio concentration,” and can be a very risky investment strategy that can leave your portfolio vulnerable. Portfolio diversification, on the other hand, is an investment strategy that aims to reduce overall portfolio risk by investing in various types of assets knowing that they will behave differently than each other. There are many ways to achieve diversification within your portfolio, from investing in stocks, bonds, real estate, cash, etc., each of which behaves differently over time depending on the underlying economic conditions. Achieving proper diversification in your portfolio is a time-tested and prudent investment strategy that can provide reduced risk and peace of mind.
There is one factor of a properly diversified portfolio that can often be overlooked by investors. “Home bias” is a common pitfall amongst investors in which they prefer their domestic assets rather than assets from outside their own country. Many reasons can explain this home bias, but one of the most common reasons is investors feel more comfortable investing in securities that they are more familiar with. Unfortunately, this bias is limiting investors in their ability to achieve proper diversification within their portfolios and oftentimes leaves them overly concentrated in their own country’s assets and their country’s dominant sectors. This blog will explore international investing and the role it plays in your portfolio. We will discuss the benefits, opportunities, and items to be aware of when considering adding an international allocation to your holdings.
Diversification Matters:
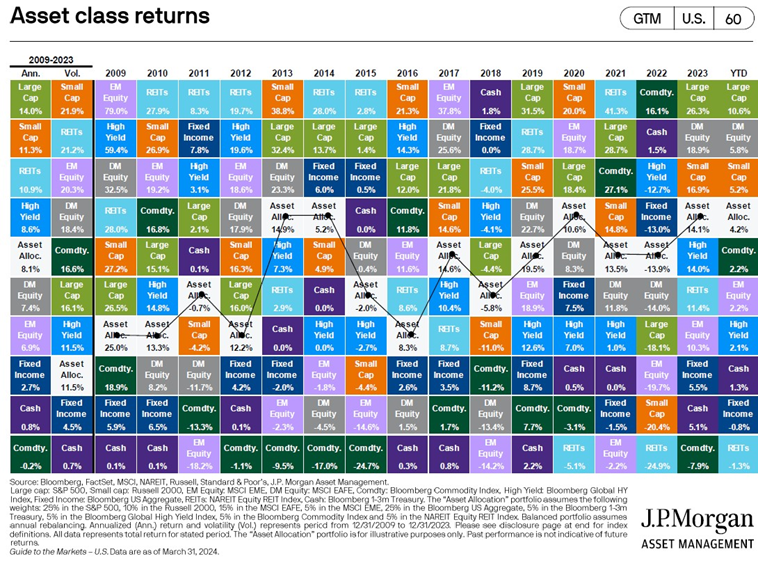
As we discussed above, diversification is a vital aspect of developing a resilient investment strategy that can assist you with achieving your financial goals while spreading your risk amongst various asset classes. Below is a helpful representation as to why diversification matters in an investment portfolio. Just as it is extremely hard to time the market, it is also a challenge to predict which asset class will outperform another in any given year. The below chart illustrates the performance of different asset classes in each calendar year from 2009 to the second quarter of 2024. What you’ll notice is asset classes perform differently from year to year, primarily due to underlying economic conditions. Diversification comes into play when you have exposure to various asset classes to ensure you reduce risk and smooth out your returns over time.
The logical question to ask next is how does diversification work in practice. The answer lies in the correlations of assets, the degree to which two assets move with each other. This is especially true when it comes to investing internationally and thinking globally rather than being laser-focused on domestic assets.
Below is a correlation matrix provided by MorningStar illustrating the degree to which international equities move with each other.
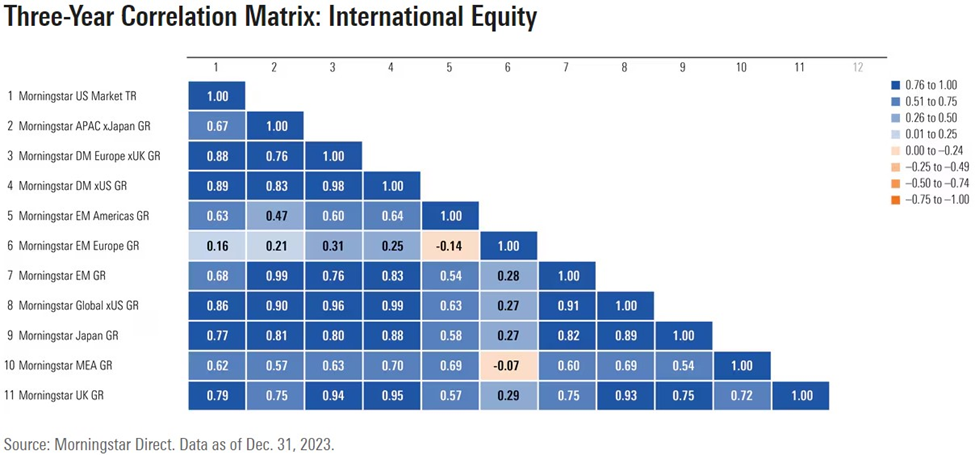
In the above chart, the darker the rectangle, the more highly correlated the assets are. As an example, the MorningStar US Market TR is highly correlated to the MorningStar Developed Market Europe xUK index at .88 but has a low correlation to the MorningStar Emerging Markets Europe index. To put it simply, when the US market moves in a certain direction, most of the time so do the developed markets of Europe. However, emerging markets in Europe are not highly correlated with the US market providing diversification benefits since those asset classes behave differently.
In recent years, the correlation between US equities and international equities has become more correlated as we have experienced a more globalized economy. However, historically this has not always been the case, and diversification benefits are still present within international markets.
Home Bias & Sector Comparison:
Investors often fall into the trap of preferring their own domestic assets and ignoring the larger global picture. As an example, according to Barclays in the United Kingdom, it is estimated that on average approximately 25% of portfolio allocations are in UK assets despite UK assets comprising only 4% of the global market index.
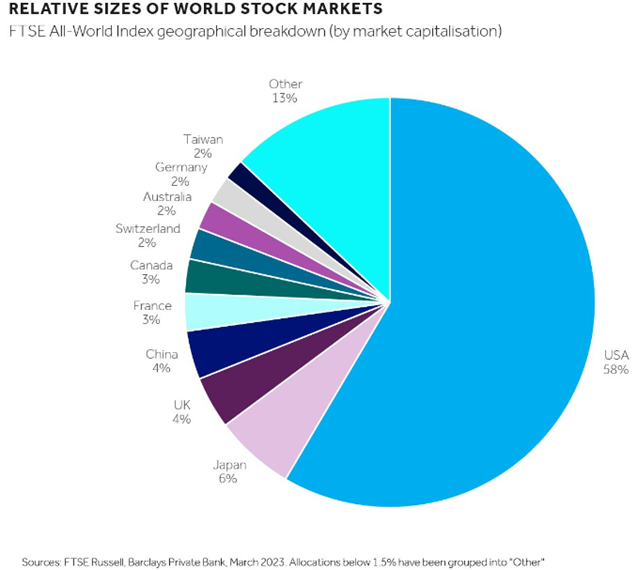
This example of home bias demonstrates an investor’s inability or apprehension to invest outside of their borders. This causes a few different problems and lack of diversification is chief among them. There is also another, more granular, issue with home bias that has to do with the composition of each country’s equity markets. For example, in the United States, roughly 32% of the S&P 500 is comprised of growth-oriented technology companies.
S&P 500 index sector weights as demonstrated by SPY
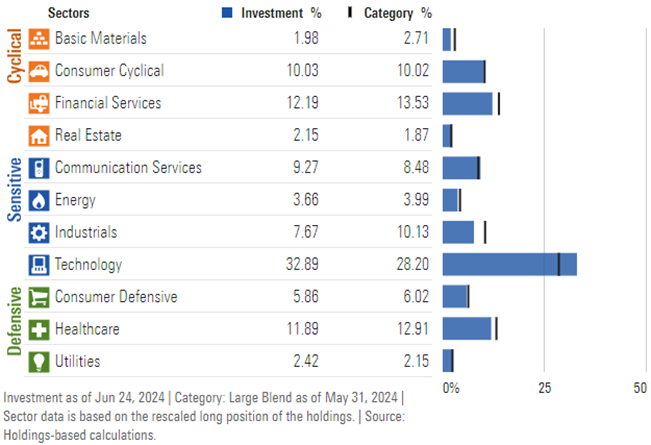
However, if we look at a broad-based international index as demonstrated by the MSCI EAFE, which is an index that tracks Europe, Australasia, and East Asia, we can see that the market composition is completely different. As demonstrated by the below chart, the sector composition for the MSCI EAFE is not as overly concentrated in any one sector to the degree the S&P 500 is. Additionally, the composition of this international index is more heavily tilted towards companies that would be considered value stocks as opposed to the US that is tilted heavier toward growth stocks.
MSCI EAFE index sector weights as demonstrated by EAFE
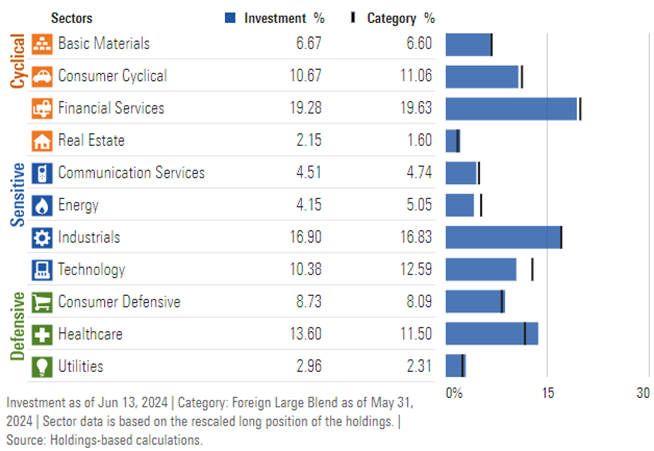
By having your portfolio heavily concentrated in your domestic markets, you may be missing opportunities and diversification benefits present from international exposures. As we can see from the index comparisons of the S&P 500 and the MSCI EAFE, there are concrete differences in each’s sector composition. Without some international exposure, you could be missing out on opportunities abroad in sectors that aren’t highly represented in your own domestic market and have too much exposure to a particular sector.
US vs. International Historical Performance:
The performance of US vs. International equities are cyclical in nature. There are periods when International markets outperform their US counterparts and vice versa. The below chart shows an illustration of the various cycles of US vs. International performance and the corresponding years that outperformance lasted and the return differential.
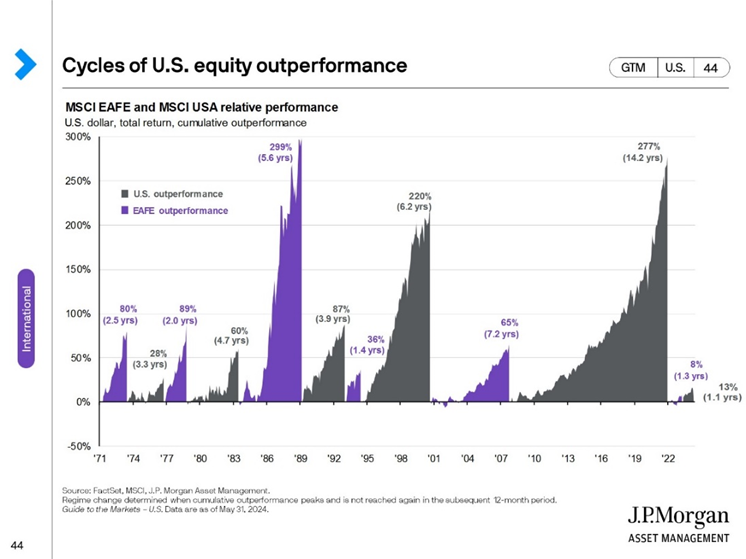
As demonstrated by the above chart, in recent history, the US experienced the longest period of outperformance since 1971 at just over 14 years. However, there are periods when having international exposure in your portfolio would have been a real benefit. The most recent period of international outperformance came in 2022 when the MSCI EAFE beat the MSCI USA index for 1.3 years with a return differential of 8%. And again, just like it’s extremely difficult to time the market, predicting when the international vs. US pendulum swings is just as difficult. By having some international exposure, you may be able to participate in upside potential even if the US market is not doing well, demonstrating another benefit to a globally diversified portfolio.
International Valuation as of 2024
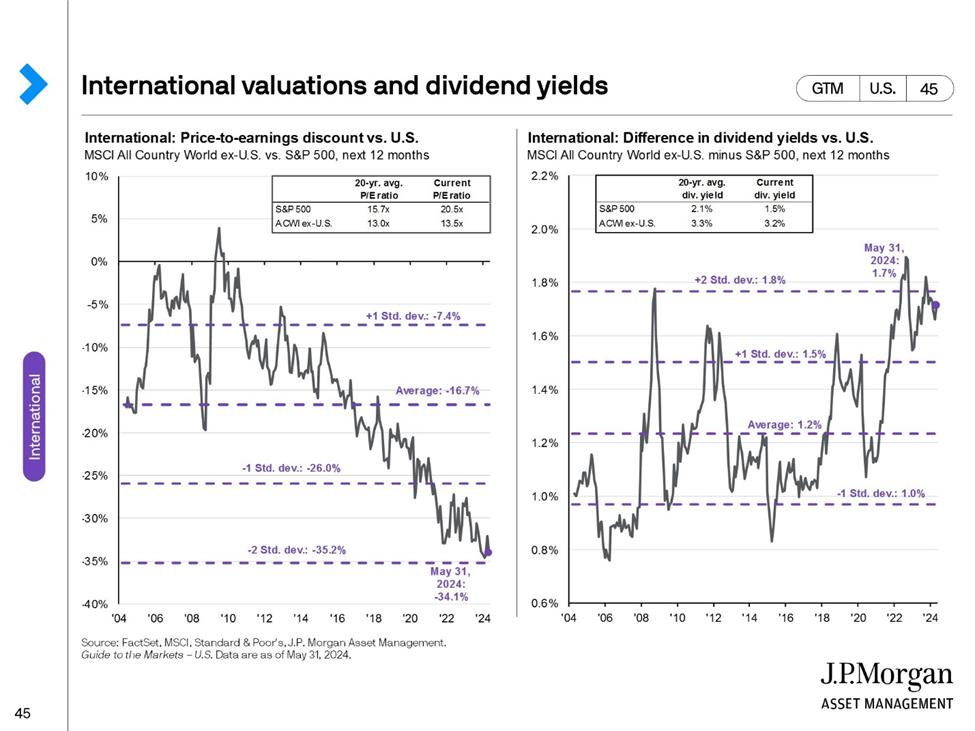
Another compelling reason to add international exposure to your portfolio stems from the current valuation differences between US equities and international equities. The below chart from JP Morgan demonstrates the differences in pricing as demonstrated by the price-to-earnings ratio (P/E). The P/E ratio is a measurement of a company’s current stock price to its earnings per share allowing for comparisons between companies, sectors, and even countries. Historically, the US market has demanded a higher P/E ratio due to the quality and growth of the companies within the S&P 500. However, at this point, international equities are cheap relative to historical averages, and the US is expensive relative to historical averages. Additionally, for income-seeking investors, international equities provide a higher dividend yield relative to their US counterparts making for an attractive investment given the valuation of US to international stocks.
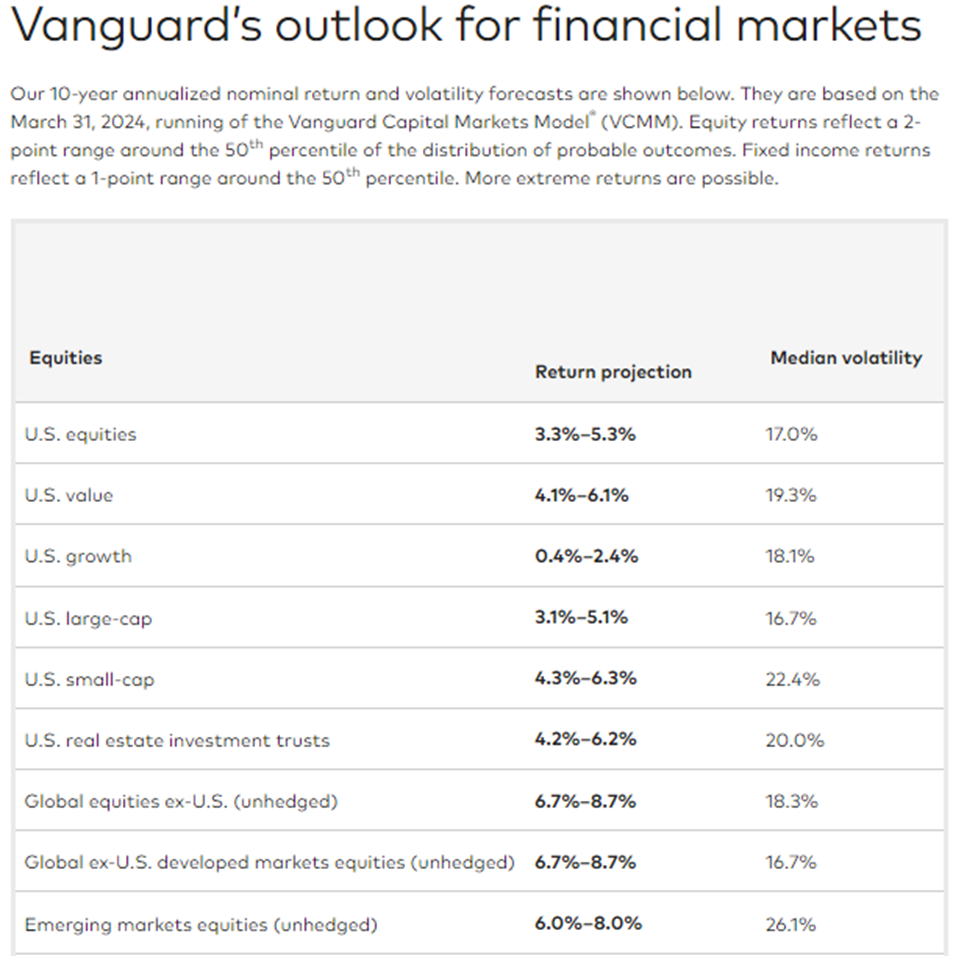
Additionally, several large asset managers such as Vanguard and Blackrock continue to argue for the inclusion of international equity given the long outperformance of the US market along with opportunities abroad. Vanguard also provides their forward 10-year return and volatility forecasts for various asset classes. Based on their research and models, they are forecasting international equities to outperform US equities over the next 10-years.
Challenges and Considerations
With every investment, there are inherent risks and challenges. Below we would like to outline a few to be aware of when considering investing internationally.
- Fees & Expenses: If you are a domestic US investor looking to invest internationally be aware that some mutual fund and ETF providers may have higher fees associated with their international offerings. This is due to different transaction costs in international markets along with the need to invest significant time and resources to understand international markets and recommended investments.
- Geo-political risks: Political, economic, and social dynamics vary from country to country and can be hard to understand and foresee for domestic investors. Additionally, differences in legal systems from country to country could cause potential issues for investors internationally.
- Currency: If you are a US-based investor looking to invest directly in international stocks, you would be required to exchange your dollars for foreign currency. This would bring in currency risk for the holding period as the value of each country’s currency appreciates or depreciates relative to the other. Generally, utilizing a vehicle like a fully hedged international ETF or mutual fund is the preferred route.
- Liquidity: Liquidity risk refers to the risk of not being able to sell your investment quickly and convert it to cash. This risk is present when investing directly in international markets, especially emerging markets. Here again, utilizing an ETF or mutual fund with ample liquidity is preferred if you want exposure to these asset classes.
Conclusion
Keeping a global perspective when constructing your diversified portfolio may help to reduce overall portfolio risks and help you take advantage of opportunities abroad. Countries vary in the composition of their markets and it’s important to consider this granular detail to understand the risks and opportunities you have exposure to. Although US equities have outperformed international in the recent past, it’s important to remember that this relationship is cyclical and it’s very hard to predict when international or US markets will outperform the other.
At Weatherly, we specialize in personalized financial planning and creating customized portfolios to meet the needs of our clients. As part of our portfolio construction, Weatherly has maintained an overweight to US equities over the last decade due to favorable economic conditions in the United States and the historic period of outperformance relative to international equities. However, within client portfolios, we retain exposure to international equity given all the reasons mentioned in this blog post.
Our team of experienced advisors are here to discuss your financial needs and goals. Through our financial planning and investment management services, we seek to offer you clarity and confidence on your financial journey.
** The information provided should not be interpreted as a recommendation, no aspects of your individual financial situation were considered. Always consult a financial professional before implementing any strategies derived from the information above.
As the United States draws closer to the presidential election in November and the end of the current election cycle, many individuals may have questions and concerns about the intersection of financial markets and politics. However, when it comes to markets and your portfolio, how much impact do elections really have?
In this blog post, we review the history of US presidential elections and their impact on markets and explain why it’s important to remain disciplined and keep a long-term mentality when it comes to your portfolio and financial goals. We also touch on important financial planning considerations to think about as we head into the final stretch of the 2024 US presidential race.
Impact of Presidential Elections on Markets:
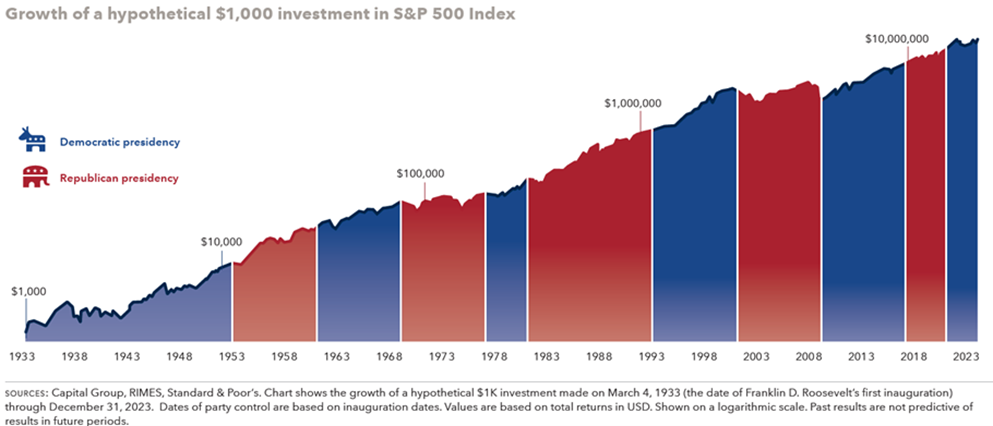
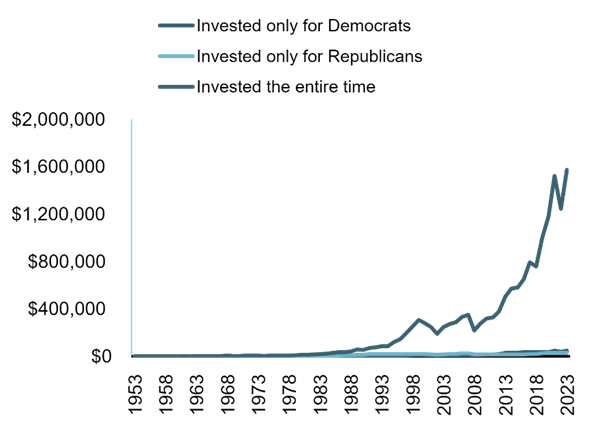
The gravity of elections is not to be understated, American policy and sentiment will change because of this year’s election. However, the impact on financial markets is not as material as people may assume. Since Franklin D. Roosevelt stepped into office in 1933, there have been eight democratic and seven republican presidents. A $1000 investment in the S&P 500, held through all 15 presidents, would have been worth over $21 million at the end of 2023. The returns generated by holding the S&P 500 regardless of election results have historically been far superior to any attempt to “time” the market based on which political party holds the White House. There appears to be little viability for an investment strategy that uses political party affiliation as a timing mechanism. The graphic below showcases the consistent upward climb of US stocks, regardless of the party in control, reiterating the importance of holding through short periods of volatility that may surface leading up to an election.

The insignificance of party affiliation on stock market returns can also be seen within the House and Senate. There is no statistical significance on stock market returns when the house and senate are both controlled by the same political party. According to Forbes, the stock market showcases the best-annualized returns when Congress is split. This is due to a natural balance of power that occurs in the legislative branch, where neither party can fully enforce their agenda resulting in a more natural development of the economy. To understand how politics have little effect on stock market outcomes, it is important to understand how financial assets derive their value.
Market returns are seldom guided by political idealizations. The impact election cycles have on markets is dwarfed by the effects of the current economic cycle and interest rates on stocks and bonds. The stock market tends to focus on the economic environment, a company’s financial health, cash flows, etc. to determine the viability of an investment. To increase success, companies primarily focus on their underlying business, market dynamics, and effective investment opportunities to keep the business healthy and viable. These decisions are made rationally and apolitically to best provide for the company and shareholders.
As we have demonstrated above, markets tend to be agnostic to the results of a US Presidential election in the long run. However, with increasing political discourse in the months leading up to an election it is not uncommon for markets to experience some form of volatility. With the constant news cycle, it may seem like the current political and economic backdrop is unprecedented, but it is important to keep in mind that uncertainty and controversy have surrounded every election. Therefore, it is vital to maintain a disciplined and long-term view of markets and your portfolio to avoid common pitfalls.
Staying Invested vs. Flight to Safety
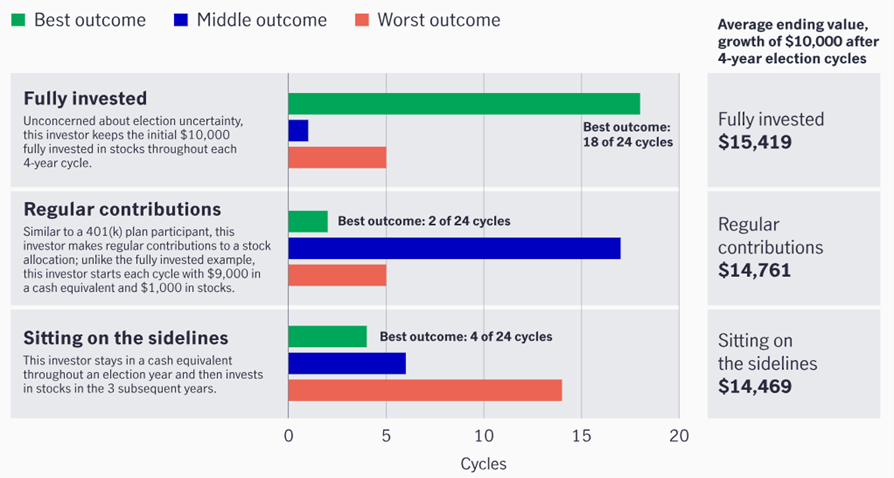
Sitting on the sidelines of the market is a strategy that historically has not paid off. This is also true when it comes to election years. Data of the 23 election cycles since 1932 shows that a continuous investment, not based on election cycles, outperforms sitting on the sideline to avoid potential volatility. With an original investment of $10 thousand, the strategy that chose to stay uninvested on the sidelines until after the election results historically underperformed the strategy that was fully invested by over 6% for the four-year observation period. This example showcases how time and longevity in markets have historically outperformed strategies associated with political party affiliation.

However, investor behavior seems to ignore the prudent strategy of “staying the course” during election years. Investor uncertainty around elections can be quantified by the large influxes of capital into money-market funds late in the election cycle. The last two years of an election cycle show a much larger inflow of assets into money markets than equity funds, displaying a retreat to safety by investors wanting to stay away from election-induced volatility. While cash can present as an attractive safety net, it is not a shelter needed for political volatility. Political idealizations that show up in markets tend to have short-lived ripple effects that are non-material when it comes to investment and financial planning.
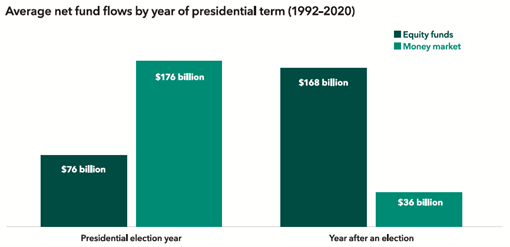

As the data shows, the unwarranted retreat to safety comes at the cost of returns. When it comes to your financial success, it is more important to focus on time than timing. We see in the different graphics that a steady and continuous investment strategy performed the best throughout the emotion-based volatility seen during election cycles. Elections provide an opportunity for people to voice their opinions on hot-topic issues, causing panic among individual investors. The threat of new political ideas coming from the White House can cause people to fear for their future, thus positioning themselves on the stock market sideline when it is not needed. We believe that political discourse is important for the future development of our society. Without elections and the democratic process, people’s voices would be lost, drastically changing the core foundation the United States was founded on. However, it is important to keep political idealizations separate from your financial plan.
Financial Planning Considerations:
While we have seen that historically markets tend to focus on the broader economy rather than which party holds power, there are other topics to consider that are completely separate from financial markets. In 2017, the Tax Cuts and Jobs Act (TCJA) was passed which led to significant changes to our tax code. However, most of these revisions to the tax code are set to expire in 2025 if there are no updates to the legislation. Some of the items set to expire include the following:
- Estate Tax Exemption: The current estate tax exemption for 2024 is $13.61 million per person or $27.22 million per couple. This is set to expire in 2025 if there are no changes.
- Standard Deduction: The 2017 TCJA temporarily raised the standard deduction which is set to expire in 2025.
- Income Tax Rates: The TCJA decreased tax brackets across the board and will revert to pre-2018 levels in 2025.
For additional current tax information, you can reference our key data chart. Although these aspects of the tax code are set to expire in 2025, nothing is certain and there is a strong possibility that there will be further revisions to the tax code moving forward. However, with proper preparation and planning, there are opportunities present that you can take advantage of by consulting with an experienced group of financial professionals. Weatherly Asset Management has been having conversations with clients about the expiration of these tax laws and we continue to develop strategies to help our clients achieve their financial goals.
Staying the Course:
Historically speaking, markets have remained agnostic to the results of the US presidential election. In the period leading up to elections, it is not uncommon for markets to experience some form of volatility, but it is important to remember that in the long run what matters most is the underlying fundamentals of the economy. It is also important to keep in mind that uncertainty and controversy have been affiliated with every election cycle in US history, and that should not keep you from staying the course and maintaining a disciplined mindset when it comes to navigating markets.
We seek to offer peace of mind through professional investment management and holistic financial planning. Through our investment management services, we create customized portfolios to match your risk tolerance, time horizon, and financial goals by maintaining an appropriate, long-term asset allocation. Through our financial planning services, we take your financial picture and create a customized road map illustrating actions needed to achieve your financial goals. Within our financial planning services, we also create various “what-if” scenarios to address the changing landscape of your life, goals, and the broader economic and investment backdrop. Whether it’s creating portfolios, developing financial plans, or talking through your questions and concerns our group of experienced professionals are here to serve as your partner along your financial journey.
** The information provided should not be interpreted as a recommendation, no aspects of your individual financial situation were considered. Always consult a financial professional before implementing any strategies derived from the information above.
Thorough financial planning and a well-diversified portfolio provide some of the best resources to handle volatile interest rates and inflation. These rates affect everything from spending and borrowing costs to mortgage rates, making it relevant for every level of consumer. Throughout history, the Federal Reserve, the central bank of the United States, has used different tools and data points to foster the US economy and to mitigate financial crises. Used by the Federal Reserve, the federal funds rate is the interest rate that financial institutions use to make loans to one another. The federal funds rate is also the tool the Fed uses to maintain stability in inflation and unemployment, leaving inflation and interest rates tightly intertwined. The Federal Reserve will lower rates to spur the economy and raise them to keep an inflating economy in check.
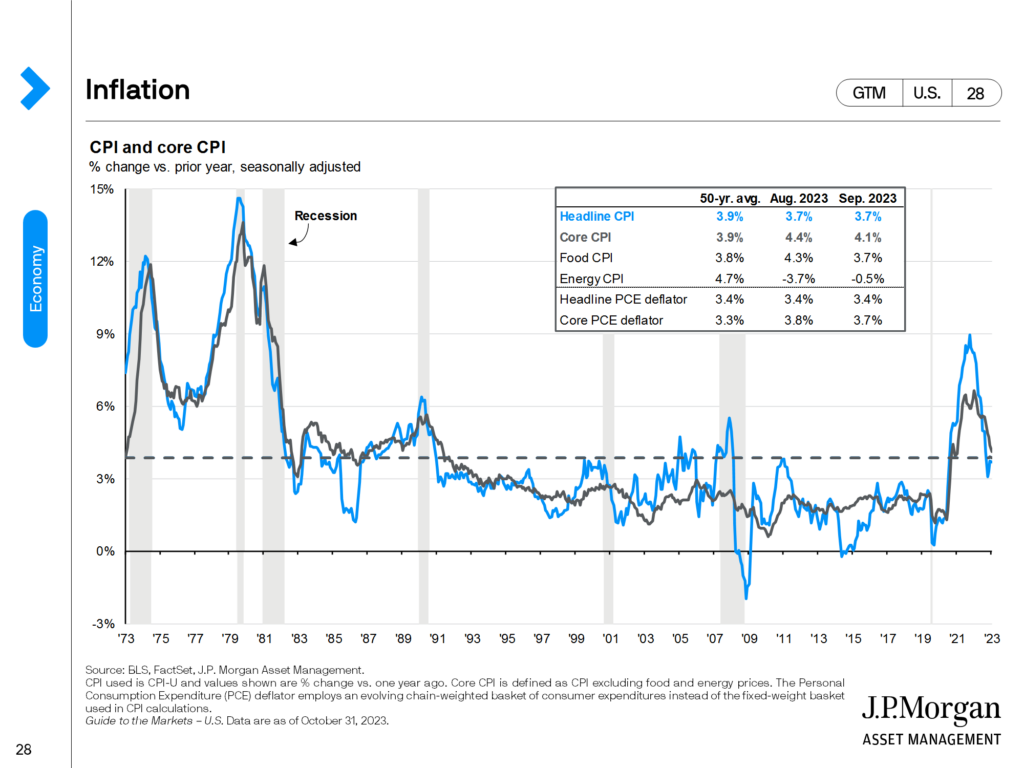
The Federal Reserve also uses Consumer Price Index and Personal Consumption Expenditures data to gauge inflation. Core CPI is another useful gauge as it provides the same data as CPI, less food and energy, the prices that tend to be the most volatile. CPI data is categorized as a lagging indicator, meaning its data points are known after they have occurred. Additional lagging indicators such as unemployment and rent provide information on the direction of the economy.
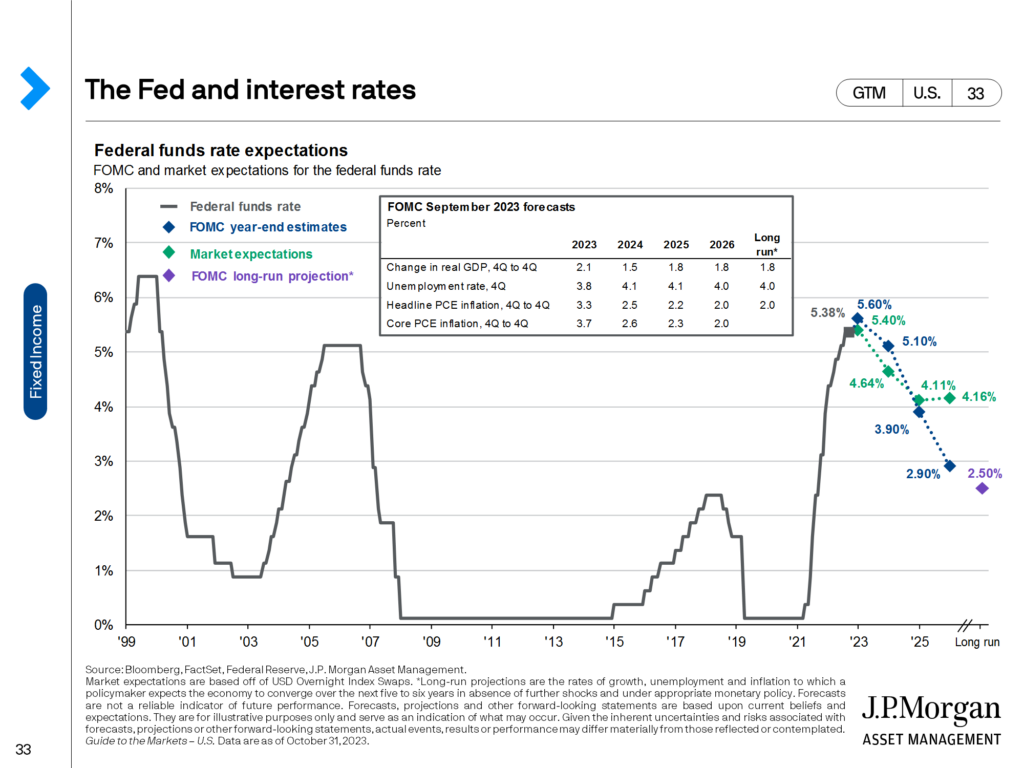
Understanding previous periods of volatility, and the goal of the Fed, provides groundwork for understanding the state of today’s current environment. The following will look at periods of times with high volatility in inflation and interest rates and how they coincided with periods of expansion and recession.
Great Depression (1929-Late 1930s)
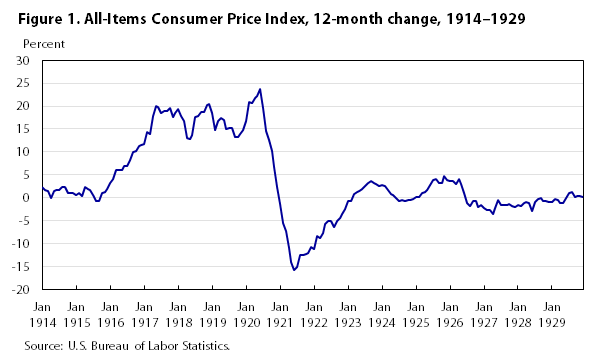
After a long period of expansion, the stock market crashed in October of 1929 due to an overpricing of assets. After the crash, the United States economy saw a rapid economic decline across the board. The price of goods in the 1939 CPI were cheaper than the basket seen 20 years earlier, while people still struggled widely to afford them . From October 1929 to April 1933, the price of the CPI basket declined over 27%, leaving the Fed to navigate a deflationary period of the economy. Leading up to the crash, interest rates were around 6.25%, Interest rates were increased to 4% due to global macroeconomic factors such as the UK abandoning the gold standard, putting a deeper dampening on the US economy. The gold standard is a monetary system where a country bases the value of its currency in direct relation to the value of gold. Using the gold standard can curb the phenomena of inflation, but it comes with its challenges like supply and demand issues. The US, feeling the global pressure, moved to abandon the gold standard in 1933. Interest rates remained low until mass economic expansion post WWII, and the CPI basket did not reach pre-depression prices until 1943.
The Great Inflation (1965-1982)
The Fed spent the period between the Great Depression and the Great Inflation introducing policies and efforts that raised the money supply, stimulating the economy, while also creating record levels of inflation. The federal funds rate rose to its highest level in history during the 1980s. The United States was heading towards record levels of inflation with CPI being over 14% and core CPI being above 13%. To combat the rising interest rates, the Fed set their target rate to 14% in January of 1980. Shortly after, raising the target rate to the highest it has ever been, just under 20%. Due to the increase, the cost to borrow also went through the roof, as 30-year fixed-rate mortgages hit nearly 20% for a short period of time. There are similarities between The Great Inflation and now. In October 1981, there was a 5% increase on mortgage rates YoY, while November of 2022 saw a 4.1% increase YoY. Home sales dropped over 20% in 1980, not unlike the trend seen in 2022. Leading up to this inflationary period, the Fed held rates around 5%, the common target rate also seen today, while CPI hovered between 5-6.5%. Between 1978 and May 1980, there were several rate hikes put into effect by the Fed, raising rates from 6.5% to 20%. The quick and steady increase of rates was needed to reestablish price stability within the US economy with an inflation rate over 12%. From September 1981 to September 1983, inflation dropped 8% but bounced around throughout the rest of the decade. Interest rates were ultimately lowered to 3% in the early 90s through a long series of rate cuts by the Fed.
The Dot Com Bubble (Late 1990s-2002)
A period of long economic growth in the 90s followed the Great Inflation. The Fed was able to reduce interest rates and keep them stable to promote economic growth and create huge levels of growth in the stock market. The Dot Com bubble was an overvaluation of internet-based companies, causing a large influx of investments into lower quality companies. The economic loosening of the Fed mixed with the overpricing of these assets caused the Nasdaq 100 index to increase over 500% from 1995-2000. Interest rates rose slightly during this time from 5% to 6.5%. Following the bubble burst, the Fed dropped interest rates from 6% to 1% in hopes of stimulating a stock market that saw some of its indices lose over 70% of their value. CPI data rose slightly during the build-up of the bubble but declined steadily after, settling in around the Fed’s goal of 2%. The dot-com recession lasted from March to November 2001, but the Fed was initially worried that the economic recovery was lacking as measures of consumer confidence continued to drop till early 2003. The 9/11 terrorist attacks also added to the continued negative outlook, causing more rate cuts due to geopolitical tensions. By mid-2003, inflation was extremely low—core PCE was at 1.78% in January and bottomed out at 1.3% towards the end of 2003.
The Great Recession (2008-2015)
The mid-2000s were a recovery phase for the United States economy, the stock market slowly recovered, mortgage rates came down, and Core CPI remained between 2-3%. During this recovery period, the Fed systematically raised rates 17 times between 2004 and 2006, each time by 25 basis points, from 1.25% to 5.25%. The rate increases were designed to tame the bubbling housing market that ultimately came to a head at the end of 2007. The Fed quickly tried to cut rates in the last quarter of 2007, with the funds rate ultimately reaching near-0% in December 2008. The recession caused CPI data to experience a short deflation period as parts of the stock market lost over 50% of their value in the span of 18 months. Consumer sentiment in the middle of 2008 was extremely low and comparable to feelings had in mid-2022 during the bear market. Crude oil at the start of the recession cost over $140 a barrel, dropping to $70 by the end of the recession. This price movement is also very similar to what was experienced during the bear market, inflationary period in 2022. With low rates and disinflation periods, unemployment doubled to over 10% causing one of the most widely felt recessions in quite some time.
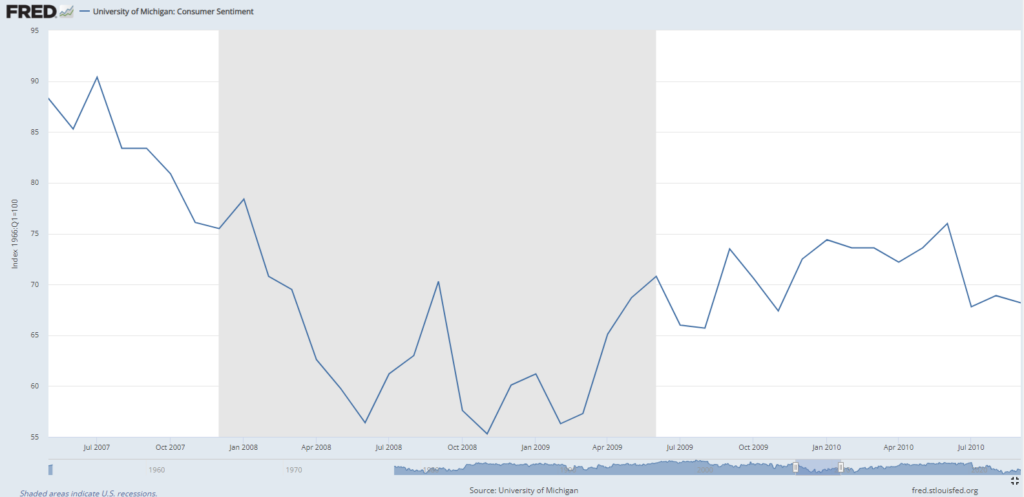
Source: FRED. Shaded in portion of the graph is designated as the Great Recession.
COVID Pandemic (2020-2022)
After leaving rates near-zero, the Fed slowly raised their target rate throughout the mid-to-late 2010s. Core PCE inflation was 1.1% in December 2015, well below the Fed’s target of 2%. It would slowly rise as the Fed raised rates, reaching its target level in March of 2018. Following conflicts stemming from a trade war with China, the Fed cut rates a total of 0.75% during the end of 2019 to mitigate any negative geopolitical catalysts. The COVID-19 pandemic struck early in 2020 and immediately shut down the globe. Production, trade, employment, and markets plummeted as public safety and recovery came to the forefront. The Federal Reserve dropped rates to zero and congress introduced stimulus packages to help a declining economy. The stock market and consumers responded well as the market climbed throughout the remainder of 2020 and into 2021. While the economy was growing again by May 2020, marking the shortest recession on record, the fallout from the economic measures to cope with the COVID pandemic are still being felt. Supply chain issues, a shortage of labor, and low rates with a large influx of cash being injected into the economy raised CPI to its highest levels since the Great Inflation in the 1980s . In turn with this the Fed began raising rates in March 2022, with the last raise coming in August 2023. These rate hikes have been able to wrangle inflation as the October 2023 CPI data came back at 3.2%, down from the almost 9% inflation seen in mid-2022. Consumer sentiment is slowly on the rise from its lowest level since 1980 as economic data continues to show recovery from the fallout of the COVID pandemic.
Post Pandemic and the Now
As we enter a period post pandemic, consumers and businesses budgets are feeling the heat of higher borrowing costs, easing but higher inflation, and resumption of student loans repayments. Each central bank around the world is continuing to evaluate data and current policies to define their policies moving forward. During the pandemic we saw globalization trends regress a bit with global supply chain issues coming to the forefront. While many of the world’s activities have resumed, such as travel and discretionary spending, we have seen dramatic volatility of demand worldwide impacted by inflation and interest rates. Moving forward, the economic outlook, spending and hiring will continue to ebb and flow with the variation of inflation and interest rates.
Inflation, Interest Rates and Your Individual Financial Plan
Having a successful financial plan, along with a well-diversified portfolio puts you in a better position to weather the storm in volatile environments. Long-term financial success is driven by an accurate financial evaluation that successfully manages cash flows and future expenses, accounting for inflation. Your advisory team is here to review and modify your financial plan to adjust for economic circumstances while offering you peace of mind. Continually reviewing items like your debt/interest rates, income projections and asset allocation are paramount to a successful long-term plan.
** The information provided should not be interpreted as a recommendation, no aspects of your individual financial situation were considered. Always consult a financial professional before implementing any strategies derived from the information above.
Artificial Intelligence, or its short form AI, is a term new to many people, but did you know that it has been around since the 1950s? In fact, AI has already woven itself into our day to day lives. While it is easier to identify certain technology that has been considered “life changing” such as the internet, social media and smart phones, AI helps drive these technological advancements. The broader technology sector has grown from the smallest sector by weight in the S&P500 to the largest sector within a handful of decades, and the spillover effect of technology has transformed other industries leading to overall growth in the global economy.
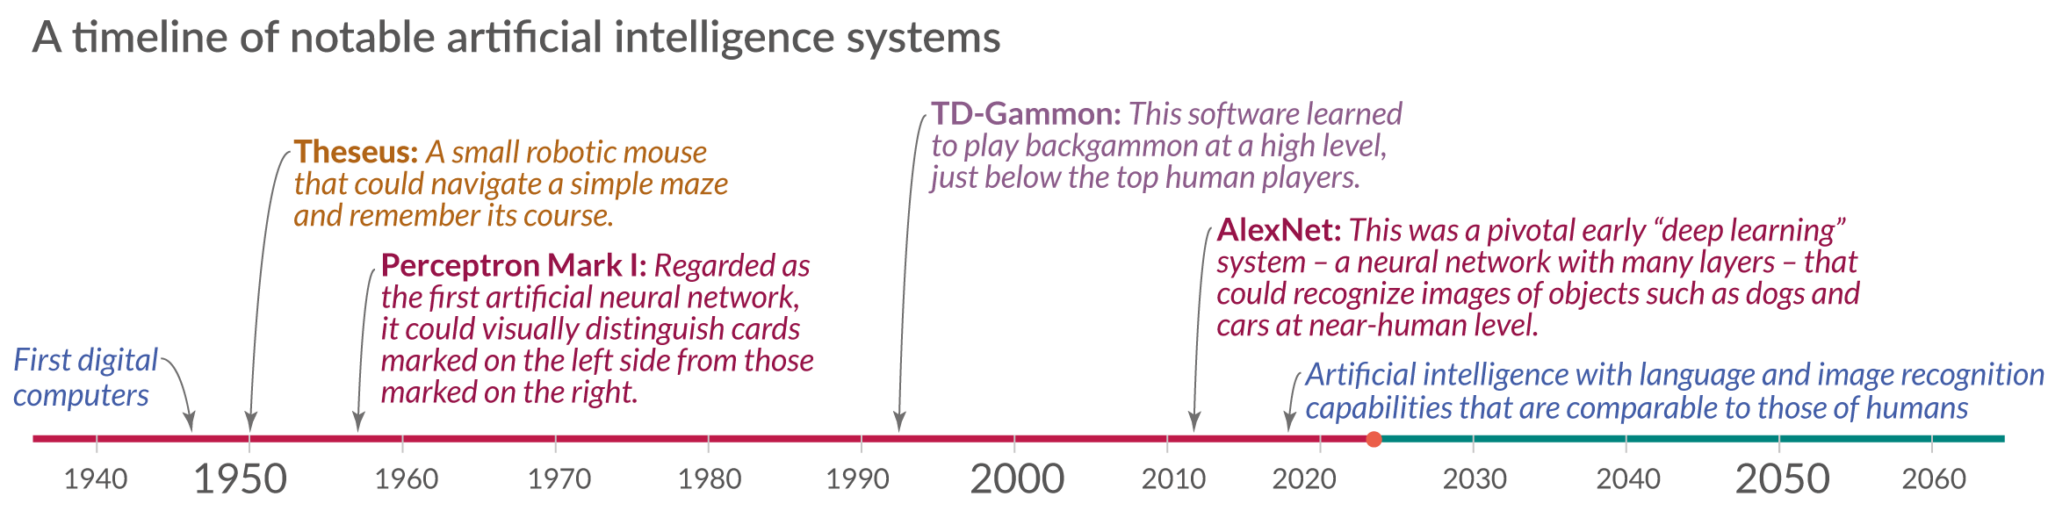
Timeline sourced from: Our World in Data
Today, AI is being popularized once again with large companies spending billions of dollars to back chatbot programs like ChatGPT, Microsoft’s revamp of Bing and Google’s newly released Bard. While AI and technology have had a relatively short existence, the snowball effect is leading to new opportunities and concerns for what the future might hold. With more companies beginning to weigh in on the potential impact of this new tech landscape, Weatherly has been observing opportunities for investment, identifying potential concerns and embracing ways to enhance our client experience.
The Good – AI Present and Future
With new applications and possibilities, advancements in artificial intelligence have impacted almost every industry and profession.
Education – Today, AI is being used to improve courses, grade papers and create interactive exams. The future holds a more personalized education system which can identify weaknesses and create teaching methods and adaptive programs specific to a student’s special education needs and learning styles. With AI to assist, students can have a more well-rounded knowledge base or choose to specialize in a certain area.
Legal – Though AI is more likely to aid than replace attorneys in the near term, its use to review contracts, find relevant documents in the discovery process, and conduct legal research has helped to eliminate some of most tedious tasks for lawyers. The use of AI in the legal sector has the potential to improve the efficiency and accuracy of legal services, while also reducing the cost for clients.
Health Care – While not a replacement for human doctors and healthcare providers, AI technologies have created unprecedented opportunities in the medical field. Currently, AI is being used to automate administrative tasks such as pre-authorizing insurance, following up on unpaid bills, and maintaining records. Additionally, the capabilities for AI powered programs to analyze vast amounts of data and detect information that may not be apparent to the human eye, can facilitate targeted cancer therapies such as radiation, and could lead to a radical impact on early detection of diseases, diagnosis, and treatment recommendations.
Travel/Transportation – At present, AI is very involved with how we get from point A to point B. Whether it’s a navigation app on a smart phone or an airline company using AI to determine ticket prices. With AI technology people can even be physically moved in a self-driving car. While this future is already here, it is still evolving and some consumers remain skeptical.
The Bad – The Consequences and Concerns of AI in Society
Despite its benefits, there are serious concerns about the impact of AI. Some of the major potential negatives to consider are:
Job displacement – As machines and algorithms are able to perform tasks previously done by humans with superior speed and accuracy, there could be a potential for job losses in many industries.
Bias and discrimination – AI systems have the potential to be biased and discriminatory if the data they are trained on is biased or designed with implicit biases. This can lead to unfair treatment and negative unintended consequences.
Privacy- AI systems thrive on collecting and analyzing large amounts of data, including personal data. This raises major concerns about privacy and security.
Lack of transparency – AI systems are complex and difficult to understand, making it especially difficult to determine how decisions are being made. This also raises concern for how to hold companies and organizations accountable for their actions when artificial intelligence was a factor in the decision-making process.
Ethical – Should machines and other AI software be granted legal rights? Can AI be trusted with decision making despite its lack of ethical, moral, and other human considerations?
Although advancements are continuously occurring, it remains clear that technologies struggle to provide the meaning, value, and creativity that real humans can.
AI and Weatherly
At Weatherly, it is our intent to embrace the good technology has to offer and protect ourselves (and you) against the bad. We seek to identify new technology to advance our business and serve our clients in the most efficient way possible while remaining cognizant of overall risk.
Our reporting tools are used to enhance what we do by analyzing a wide scope of data so that we can stay informed and provide accurate real-time updates. To help ensure our clients don’t outlive their assets, we use financial planning software and create alternative scenarios to outline future risks and opportunities. While we can generate countless reports and scenarios the true value and real understanding occurs when we verbalize the key outcomes.
We have also fully embraced automation in processes such as account opening and document verification. We have seen huge successes and advances in the turnaround times of account establishment through our custodian’s e-tools, as well as document verification through DocuSign e-signature.
Additionally, we remain on high alert to the threat of cyber-attacks. It is our best practice to utilize the Weatherly Portal for the secure exchange of information and are always happy to serve as a resource of how to protect yourself and loved ones against the ongoing threat of cybercrime. Check out our 7 Steps to Better Cyber Security for some quick tips!
At Weatherly we pride ourselves on providing high quality, holistic, and innovative wealth management service. It is our duty to use and embrace technology in a responsible and ethical manner to enhance what we do, not as a replacement to our expertise and experience.
We strive to pair human knowledge and common sense with modern technology to maximize efficiency and deliver information in an easy to digest way.
Resources –
https://ourworldindata.org/brief-history-of-ai
https://builtin.com/artificial-intelligence
https://www.pwc.com.au/digitalpulse/report-pwc-global-ceo-survey-ai-skills.html
** The information provided should not be interpreted as a recommendation, no aspects of your individual financial situation were considered. Always consult a financial professional before implementing any strategies derived from the information above.
 As we emerge from the pandemic, there’s a lot on everyone’s mind- unrelenting health concerns, an upcoming election, escalations on the war in Ukraine, and the highest inflation the US has seen in 40 years. So, it comes as no surprise to us here at Weatherly that our most common client dialog these days begins with “When is the next recession?” And despite Weatherly’s in office crystal ball, we are balancing a historic level of uncertainty and volatility. Therefore, we wanted to take a look at current economic conditions through the lens of past recessions. By putting historical volatility in context, we hope to add perspective on current market uncertainty.
What is a Recession?
A recession is a slowdown or contraction of the economy over a business cycle and is often defined as two consecutive quarters of negative gross domestic product, or GDP. However, in the US we have the National Bureau of Economic Research (NBER), who ultimately makes recession related determinations. NBER has expanded the definition of recession beyond GDP to capture a range of indicators such as real personal income, employment, personal consumption spending, wholesale-retail sales, and industrial production.
Since the Great Depression of the early 1930s, there have been 14 US recessions. An important observation is that historical recessions are relatively small blips in economic history and are relatively short lived. Over the last 100 years- the average recession has lasted 14 months, while the average expansion was 47 months (JP Morgan’s Guide to the Markets). Similarly, their net economic impact is comparatively small. The average expansion increased GDP by almost 25%, whereas the average recession reduced economic output by 2.5%. All to say, recessions are painful but subsequent recovery can be powerful. For investors with a long-term outlook, recessions can be viewed as an opportunity to deploy capital into assets at a discount.
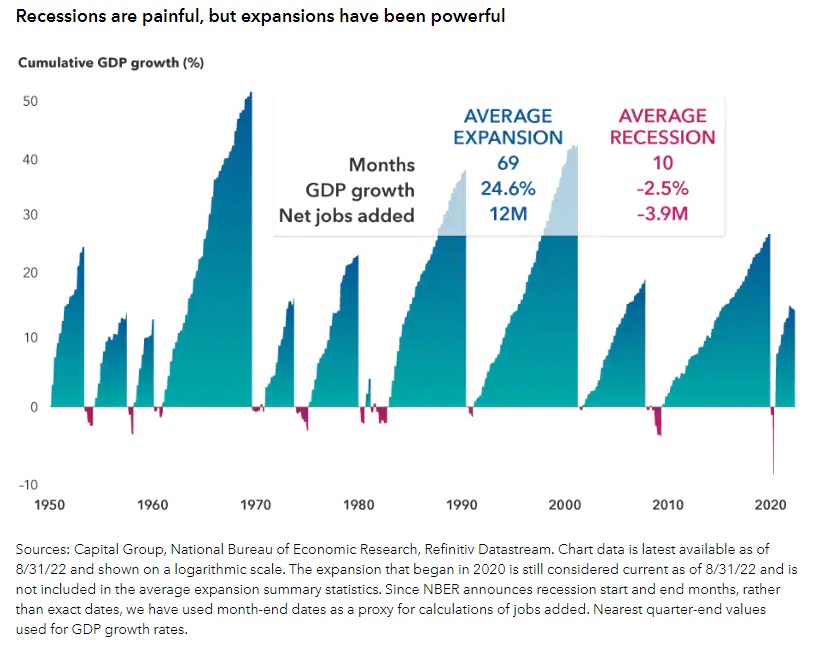
The Great Depression (1929-1933)
In the 1920s, America bounced back from the disruptions and destruction of World War I. The US economy thrived and Americans dove headfirst into their favorite, newfound wealth generating system – the New York Stock Exchange. During the Roaring Twenties, investors watched the ticker tape and leveraged their bets with historically high levels of margin to trade. Eventually, spending escalated and fueled an unprecedented increase in security pricing which caused assets to be dramatically overvalued. On October 29th, 1929, the bubble burst when the stock market crashed on Black Tuesday- beginning a period of economic contagion now considered to be the biggest recession in US History.
Chart Sourced From: https://www.capitalgroup.com/advisor/insights/articles/guide-to-recessions.html
It’s not easy, even for people who have lived through the economic downturn caused by the COVID-19 pandemic, to grasp the depths of deprivation to which the economy sank during the Great Depression. GDP fell 26.7% and in 1933, unemployment reached a striking 25.6%. The Great Depression triggered a series of economic regulation and reform that revolutionized US financial markets. After Black Tuesday and the collapse of more than 1/5th of American banks by 1933, strict trading and bank regulations were put in place. These updated financial protections were enforced by the newly formed Securities and Exchange Commission (SEC) and the Federal Deposit Insurance Corporation (FDIC). FDR’s New Deal also expanded the role of the government and introduced an array of services, regulations, and subsidiaries to address the high rates of unemployment and poverty.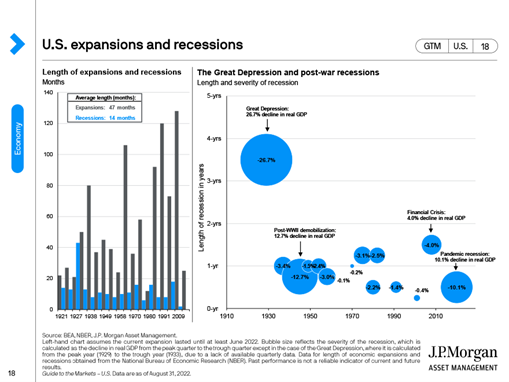
The Roosevelt Recession (May 1937 – June 1938)
The Roosevelt Recession pales in comparison to the Great Depression, despite being one of the worst recessions of the 20th century. Sometimes referred to as “the recession within the Depression”, it came before the Great Depression’s recovery was complete. Real GDP fell 11% and industrial production fell 32%, which was widely attributed to a tightening of fiscal and monetary policy related to the New Deal. (Refer to Weatherly’s A Presidential Look at U.S. Taxes for more information) It isn’t until after this recession, in 1939, that the United States economy is thought to have fully recovered from the Great Depression.
Chart Sourced From (Page 18): https://am.jpmorgan.com/us/en/asset-management/adv/insights/market-insights/guide-to-the-markets/
The Union Recession (February – October 1945)
As the US entered the sixth and final year of World War II, a decline in government spending led to a drop in GDP. The Union Recession was the result of subsequent demobilization and a general shift from wartime to peacetime. This recession got its name from the large increase in union related work stoppages at the time, which directly translated to a decrease in production and subsequent economic output. Contrary to the prognostication of economists at the time, this recession was much slower and shallower than predicted – perhaps due to the conditioned expectations of previous recessions.
The Post-War Recession (November 1948 – October 1949)
Similarly, the Post-War Recession was relatively short- lasting eight months from peak to trough. This recession proved to economists that the US had successfully adapted to the post-World War conditions. In late 1949, another robust expansionary period began that lasted 45 months with 6.9% annual GDP growth.
The Post-Korean War Recession (July 1953 – May 1954)
The Post-Korean War Recession ultimately occurred due to the high level of war related expenditures in the US and subsequent inflationary pressures. During this time, the inflation rate in the US soared from its pre-war 2% to a staggering 10%. To curb inflation, the Fed tightened money supply and the cost of borrowing. Relatively speaking, this was a brief recession- lasting only 10 months from peak to trough.
The Eisenhower Recession (August 1957 – April 1958)
In early 1957, a large influenza outbreak in Asia began to spread to Europe and then the United States by late summer. “The Asian Flu” reduced labor supply and slowed production at the same time the Federal Reserve was tightening interest rates to fight inflation. This stagnated the housing sector and auto sales plummeted. A moderate recession with a wide reach, growth restarted only 8 months later after the Eisenhower administration implemented various stimulus measures. The Federal reserve also pivoted to lower rates to 1.75%.
The “Rolling Adjustment” Recession (April 1960 – February 1961)
A “rolling adjustment” recession occurs when a slowdown in one economic sector has a pervasive effect on the entire economy. This recession occurred in line with the globalization of the automotive industry and subsequent decrease in domestic auto sales/production. During this 10-month recession, GDP declined 2.4% and unemployment reached nearly 7%. The light at the end of the tunnel was a long expansionary period that lasted nine years from 1961 to 1969. Throughout this time, cumulative GDP almost doubled, with a growth of more than 90%. This was the longest period of economic expansion during the 20th century.
The Nixon Recession (December 1969 – November 1970)
The Nixon Recession followed the lengthy period of expansion. This recession was also relatively short, lasting only 11 months from peak to trough and fairly mild. A more consequential event happened shortly after in 1971 when Nixon eliminated the gold standard. This paved way for floating currencies and the ability of central banks to exhibit more control over their economies through monetary policy. This also contributed to exacerbating the following recession and inflation due to the dollar losing value relative to other currencies.
The Oil Shock Recession (November 1973 – March 1975)
Growth resumed after the brief Nixon Recession for three healthy years. Annual GDP increased by 5.1% and annual employment increased by 3.4% during this time. This expansionary period came to an end abruptly with the 1973 oil crisis. Inflation remained stubbornly high and would soon rise to double digits despite stagnating growth, a phenomenon that came to be known as stagflation. A quadrupling of oil prices by OPEC, coupled with the 1973 stock market crash led to a stagflation recession.
The Energy Crisis I Recession (January – July 1980) and Energy Crisis II Recession (July 1981 – November 1982)
Following the Oil Shock Recession, an expansion occurred for the remainder of the decade. Inflation remained high during this period, peaking around 15% in 1980, and energy prices continued to be a particular sore point. Oil prices reached an all-time high that would not be surpassed until more than 25 years later, in 2008. This expansion was followed by a “double dip” recession. One short recession in 1980, triggered in part by the Federal Reserve’s decision to combat rising prices by raising interest rates, followed by the worst economic downturn in the US since the Great Depression from 1981 to 1982. Unemployment reached nearly 11% and GDP fell by 1.8%.
The Gulf War Recession (July 1990 – March 1991)
After the lengthy peacetime expansion of the 1980s, the Gulf War recession was mild and brief. It lasted just eight months and was a combined result of the Gulf War’s effect on oil prices and the savings and loan crisis. In August of 1990, Iraq invaded its oil-producing neighbor, Kuwait. The ensuing Gulf War created a shortage in oil production and therefore an increase in price per barrel. This, coupled with the state of residential mortgage markets caused the market to go into a recession. By the end of the 1980s, after years of historically low interest rate debt accumulation on residential mortgages, small local banks suffered as the Fed had begun steadily raising interest rates in response to growing inflation.
The Dot Com Recession (March – November 2001)
The 1990’s were the longest period of economic growth in American history up until the Dot Com Bubble. A frenzy of exuberance around the first wave of internet companies coupled with low interest rates came to a head as tech IPOs and stock prices became grossly overvalued. As the name insinuates, this recession began when the stock prices of internet companies crashed as the Fed began raising interest rates in 1999 and 2000. The tech-heavy NASDAQ ended up losing nearly 77% of its value and took over 15 years to recover its losses.
It’s important to distinguish- a stock market crash does not necessarily result in a recession. But on September 11th, 2001, the devastating attack on the World Trade Center solidified a pessimistic outlook that teetered the US economy into a recession
All things considered, the Dot Com Recession lasted 8 months with unemployment reaching 5.5% and GDP falling by 0.95%.
The Great Recession of 2008 (December 2007 – June 2009)
The Great Recession was the longest economic downturn since World War II and was the deepest prior to the COVID-19 Recession. Real GDP fell 8.5% in the fourth quarter of 2008, and unemployment peaked at 10% in October 2009. The Great Recession was triggered by the subprime mortgage crisis and the collapse of the US housing bubble. In the years leading up to the recession, financial institutions created complex securities that bundled bad mortgages and sold them as high-quality investments known as CDOs (Collateralized Debt Obligations). In 2007, major subprime lenders began filing for bankruptcy as borrowers were unable to repay their mortgages, which burst the housing market bubble. Over the next year–and–a–half, stock markets tanked, and major financial firms started going bankrupt, triggering a worldwide financial crisis and a recession.
The effects of the Great Recession of 2007-2009 continued to be felt for years. The Fed cut interest rates to zero in an effort to encourage borrowing. Congress passed two stimulus packages, and later passed the Dodd-Frank Act to tighten financial market regulation and prevent a similar catastrophe in the future.
The COVID-19 Recession (February – April 2020)
The Coronavirus recession was the shortest in US history, lasting just two months, but had the steepest GDP decline since the 1945 recession. More than 24 million people lost their jobs in the US the first three weeks of April 2020. The economic impact of the virus and the ensuing stay at home orders is to still be determined but was quickly propped up by government intervention. The Fed rapidly slashed interest rates to zero, Congress passed stimulus packages that put cash directly into American’s pockets, and PPE loans were extended to small businesses to stay afloat. Amongst the medical, social, and economic crisis- sentiment improved and the recovery from the Covid-19 pandemic was remarkably fast. Real GDP grew 5.6% throughout 2021 and the unemployment rate reached 50-year lows.
Looking Forward
Recessions are a natural and necessary part of every business cycle to remove excess, reprice assets, and tame risky behavior. While recessions have been relatively short and infrequent in comparison to expansions, they must be expected and can be mitigated through proper asset allocation, diversification of asset classes, and emergency funds- to name a few. It is vital to maintain perspective and have a long-term view. Financial plans are an excellent way to test your ability to withstand a large recession and give confidence that your assets are sufficient to meet your goals before, during, and after recessions.
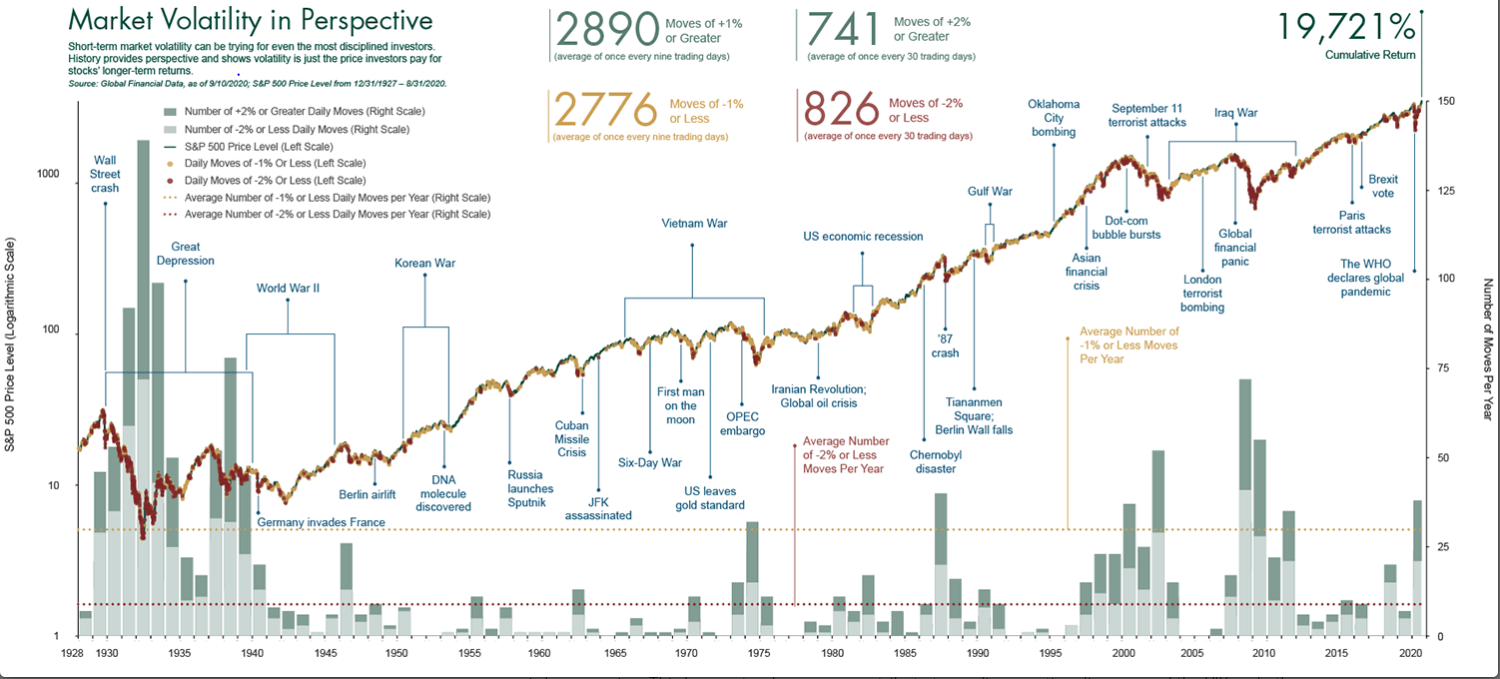
Chart Sourced From: https://www.fisherinvestments.com/en-us/insights/market-cycles/volatility/in-perspective
Further Reading
• Capital Group: Guide to Recessions
• US Economic Recession Timeline
• Net Suite’s History of Economic Recession
• Great Depression
• NYTimes Coronavirus
• Nixon Shock
Charts Sourced From:
• Chart 1: https://www.capitalgroup.com/advisor/insights/articles/guide-to-recessions.html
• Chart 2: https://am.jpmorgan.com/us/en/asset-management/adv/insights/market-insights/guide-to-the-markets/
• Chart 3: https://www.fisherinvestments.com/en-us/insights/market-cycles/volatility/in-perspective
** The information provided should not be interpreted as a recommendation, no aspects of your individual financial situation were considered. Always consult a financial professional before implementing any strategies derived from the information above.
Whether you’re new to investing or have decades of experience in financial markets, having an asset allocation aligned with your goals and risk tolerance remains one of the most important decisions investors can make. Having an appropriate asset allocation aims to balance the risk and reward, through diversification across asset classes and types. There is no one size fits all when it comes to determining an asset allocation for every investor, however it will ultimately have a larger impact on portfolio returns than security selection. In this blog post we will explore what factors to consider, importance of diversification, how an investor’s asset allocation may change over time, and various ways the Weatherly team can help you achieve your goals.
An investor’s allocation will determine how their portfolio will be appropriated across different asset classes commonly classified as equities, fixed income, and cash. Additional assets classes of importance can include alternatives such as real estate, commodities, or collectibles. Each of these different asset classes carry a different set of risk and return characteristics highlighting the necessity of setting an allocation that aligned with the investor’s overall goals.
There are several factors to consider when determining an appropriate asset allocation, including:
Time Horizon
An investor should review each of their goals to determine the amount of time until the funds will ultimately be needed. With short time horizons, within a few years, a sudden market decline may significantly decrease the original investment preventing the individual to reach their goal or recoup losses. Therefore, it’s often recommended to allocate more funds into historically safer assets such as money markets, high yield savings accounts, CDs, and other short-term high-quality fixed income securities. While the returns on these assets are low, the investor’s principle is more protected.
Conversely, longer time horizons such as saving for retirement may be decades away and can afford the investor to have a more aggressive allocation with a larger exposure to riskier assets such as stocks, equity funds, or alternatives. While stocks have more implied risk than cash or high-quality fixed income, they historically have provided greater returns over the long run, helping investors ultimately reach their financial goals.
Risk Tolerance
This refers to the degree of risk an investor is willing to endure in times of market volatility. An investor with an aggressive allocation may be willing to lose a greater share of their original investment to achieve potentially higher rates of return while a conservative investor may prioritize capital preservation and guaranteed returns.
https://www.brightstart.com/risk-tolerance-questionnaire/
While it’s important to consider both your time horizon and risk tolerance when determining an appropriate asset allocation, they might not always align. For instance, your ability to emotionally endure losses could exceed your ability to withstand them given your financial situation. Alternatively, some investors are very risk averse even if they have a significant level of assets.
The balance between risk and reward should be top of mind for investors and diversification remains a key driver. The chart below breaks down historical performance and volatility of different asset classes over time. The balanced portfolio represented by the white box highlights how diversification can help reduce risk in the portfolio and enhance returns.
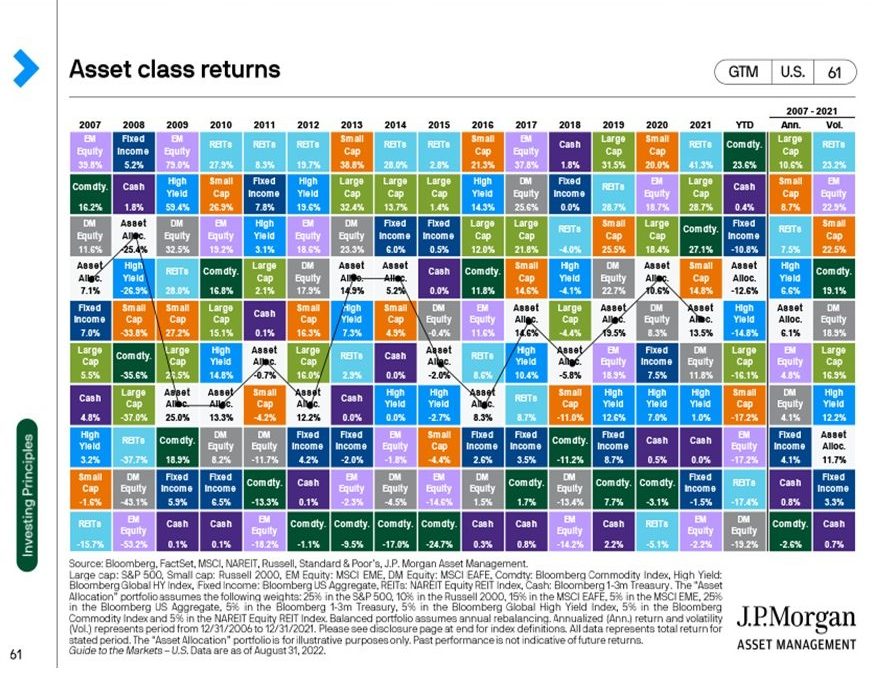
Chart sourced from: JP Morgan Guide to the Markets – August 2022, Page 61
The slide below represents the importance of an investor understanding both their personal goals and the time horizon associated. Short time periods may experience greater volatility but over the long term returns typically return to the mean.
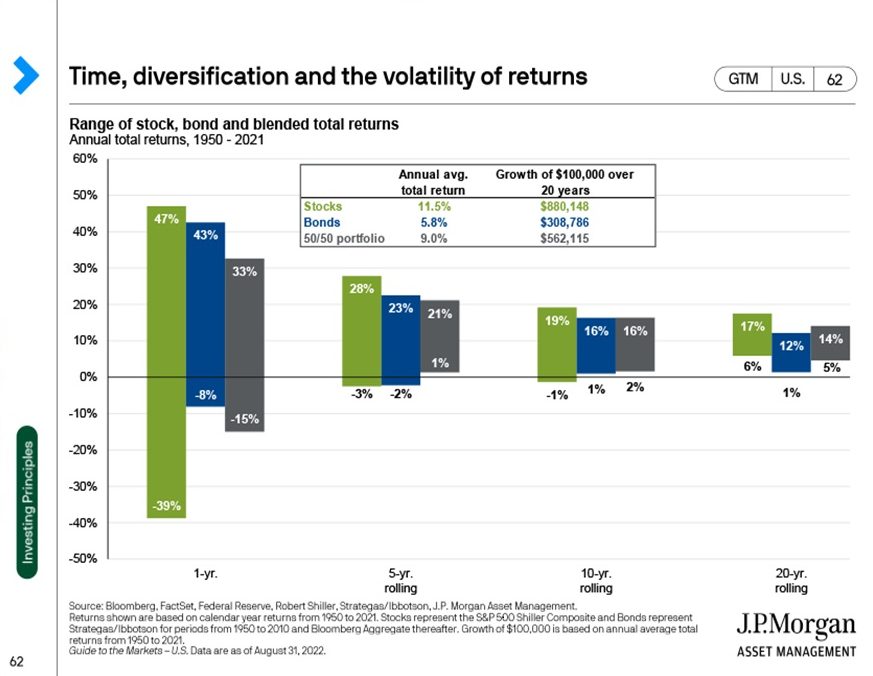
Chart sourced from: JP Morgan Guide to the Markets – August 2022, Page 62
Total Asset Allocation
Asset Allocation is the main driver of returns and should not only be reviewed on the account level but also as it relates to net worth. This can include alternative investments such as real estate, business interests, commodities, collectibles or other assets that are held outside a traditional investment account. Any concentration in these other asset types should be considered when determining the asset allocations at the account level. For example, if a client has a large position in a startup business, they may have a more conservative approach in their investment accounts to help balance total risk they are subject to. Total asset allocation can even impact individual positions in a portfolio. For example, an investor who has a large chunk of their net worth tied to real estate, may rethink investing in a residential Real Estate Investment Trust (REIT) to limit concentration to the real estate industry. Similarly, concentration in a employer stock due to stock options may impact overall investment strategy and portfolio risk. Reviewing total allocation can sometimes improve concentration concerns found in a specific account.
Asset Allocation Per Account
Although asset allocation can be viewed on an aggregate basis, it should also be reviewed on an account basis. Retirement accounts often have a tax deferral component, and benefit from long-term accumulation. Therefore, retirement accounts may favor a higher equity allocation until Required Minimum Distributions (RMDs) begin at age 72 or the client becomes reliant on income from this type of account. If possible, cash flows are taken from non-retirement accounts first, so a more conservative allocation is generally used for these accounts. Tailoring asset allocation this way can help maximize tax efficient returns over time. Additionally, there are planning opportunities that may span across multiple generations and thus require a different allocation than the individuals establishing the accounts. This can especially be seen in a Roth IRA given tax treatment and no mandatory withdrawals while the account owner is alive. A more aggressive asset allocation to this account can capture a longer period of tax-free growth and enhance a future inheritance for beneficiary or loved one.
When to Review Asset Allocation
It should also be noted that asset allocation may evolve over time as new goals develop and life happens. For example, a large liquidity event may cause investors to increase or decrease their asset allocation as their priorities may have changed. Also, investors generally shift to a more conservative allocation to reduce near term risk if they anticipate upcoming cash flow needs from a portfolio. Some examples of this could include a home purchase, looming child education expenses, large medical costs or beginning retirement. This same type of progression can be seen in target date funds which utilizes passive investing to automatically adjust asset allocation to be more conservative as a certain goal approaches.
Periods of volatility can also cause investors to review their asset allocation. During a down market, investors tend to reevaluate the amount of risk they were originally taking. If they are comfortable with the volatility, then it may be an opportune time to rebalance the portfolio by bringing the equity allocation back up to help reinflate the portfolio faster. This is often forgotten during periods of exuberance in the stock market, but it may be appropriate to rebalance the portfolio to fixed income to limit overall concentration to equities. During these periods of volatility, an active management investment style tends to benefit clients. Being able to quickly reevaluate risk profiles, allow for gains to be taken or a portfolio to be repositioned. Financial Planning can be helpful in determining the amount of risk needed to take to fulfil various goals.
How Can WAM Help
Whether you’re a new or an existing Weatherly client, we pride ourselves on open dialogue to ensure we understand each client’s needs and goals both for the short and long term to determine an appropriate asset allocation. You’ll often find a question we always ask on the front end is if there are any upcoming liquidity needs. This allows us to properly align the portfolio while also exploring areas of opportunities to reduce risk. We review current and target asset allocations several times a year to ensure the appropriate amount of risk is being taken to achieve goals and meet cash flow needs. If periods of volatility cause concern, then we revisit the target asset allocation with the client and implement adjustments, if necessary. We lean on our financial planning capabilities that help clients bring together their financial picture into a holistic and consolidated view to prioritize goals based on importance and timing. We encourage you to reach out to your trusted advisor with any questions about how life changes can impact your allocation, risk mitigation, or any other questions.
** The information provided should not be interpreted as a recommendation, no aspects of your individual financial situation were considered. Always consult a financial professional before implementing any strategies derived from the information above.