


Interest Rates, Inflation and Indices: How Do They Affect You?
Stone Churby, M.S., Wealth Management Associate | Carolyn Taylor, President & Founding Partner | November 30, 2023
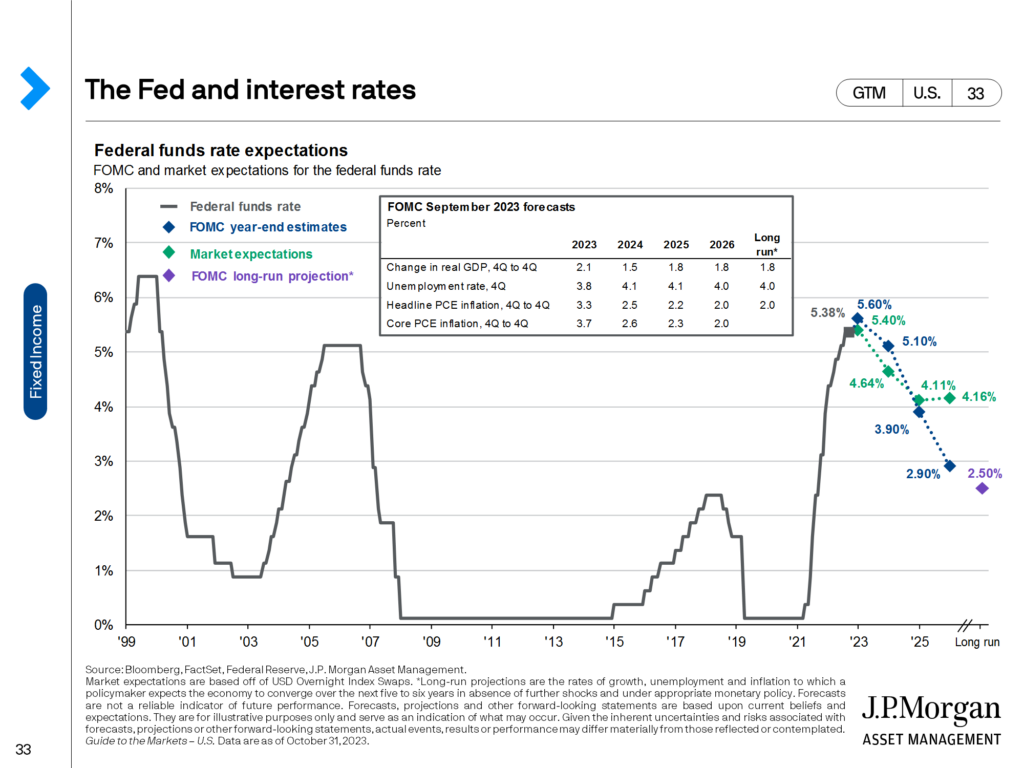
Thorough financial planning and a well-diversified portfolio provide some of the best resources to handle volatile interest rates and inflation. These rates affect everything from spending and borrowing costs to mortgage rates, making it relevant for every level of consumer. Throughout history, the Federal Reserve, the central bank of the United States, has used different tools and data points to foster the US economy and to mitigate financial crises. Used by the Federal Reserve, the federal funds rate is the interest rate that financial institutions use to make loans to one another. The federal funds rate is also the tool the Fed uses to maintain stability in inflation and unemployment, leaving inflation and interest rates tightly intertwined. The Federal Reserve will lower rates to spur the economy and raise them to keep an inflating economy in check.
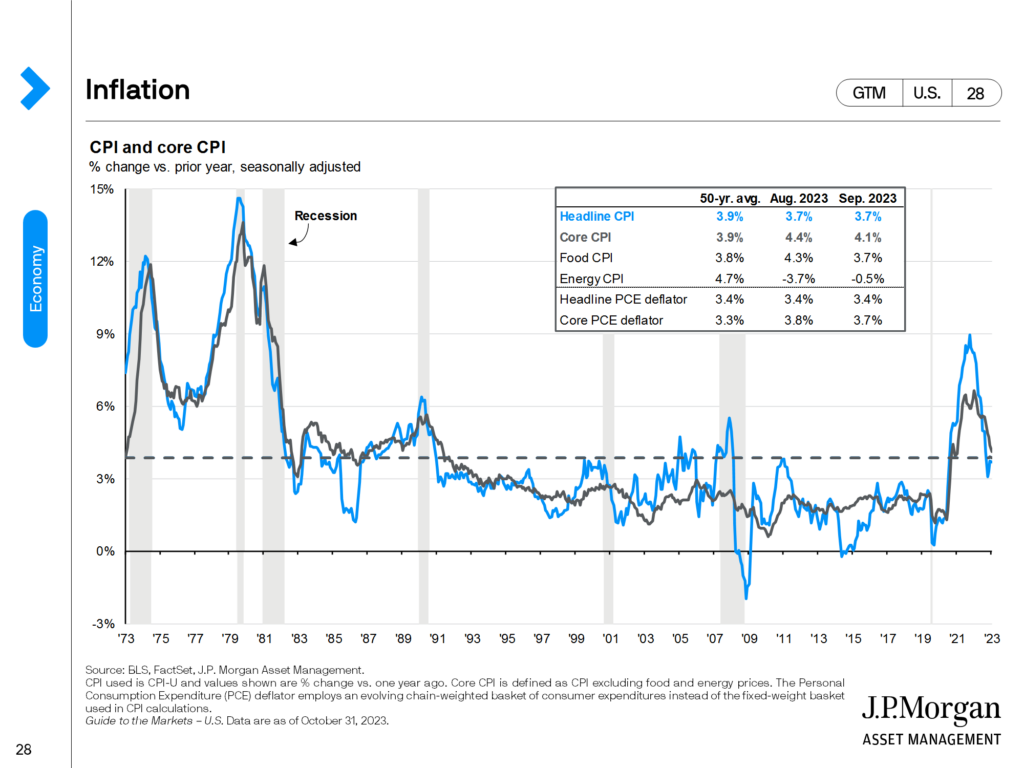
The Federal Reserve also uses Consumer Price Index and Personal Consumption Expenditures data to gauge inflation. Core CPI is another useful gauge as it provides the same data as CPI, less food and energy, the prices that tend to be the most volatile. CPI data is categorized as a lagging indicator, meaning its data points are known after they have occurred. Additional lagging indicators such as unemployment and rent provide information on the direction of the economy.
Understanding previous periods of volatility, and the goal of the Fed, provides groundwork for understanding the state of today’s current environment. The following will look at periods of times with high volatility in inflation and interest rates and how they coincided with periods of expansion and recession.
Great Depression (1929-Late 1930s)
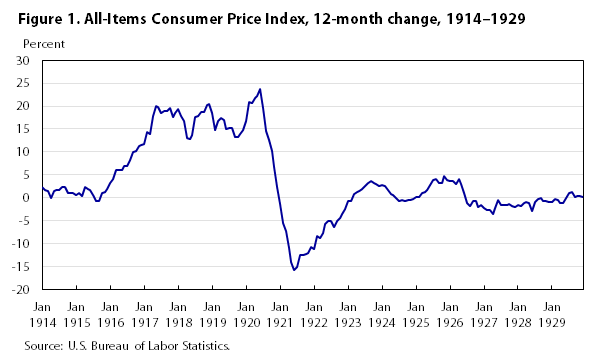
After a long period of expansion, the stock market crashed in October of 1929 due to an overpricing of assets. After the crash, the United States economy saw a rapid economic decline across the board. The price of goods in the 1939 CPI were cheaper than the basket seen 20 years earlier, while people still struggled widely to afford them . From October 1929 to April 1933, the price of the CPI basket declined over 27%, leaving the Fed to navigate a deflationary period of the economy. Leading up to the crash, interest rates were around 6.25%, Interest rates were increased to 4% due to global macroeconomic factors such as the UK abandoning the gold standard, putting a deeper dampening on the US economy. The gold standard is a monetary system where a country bases the value of its currency in direct relation to the value of gold. Using the gold standard can curb the phenomena of inflation, but it comes with its challenges like supply and demand issues. The US, feeling the global pressure, moved to abandon the gold standard in 1933. Interest rates remained low until mass economic expansion post WWII, and the CPI basket did not reach pre-depression prices until 1943.
The Great Inflation (1965-1982)
The Fed spent the period between the Great Depression and the Great Inflation introducing policies and efforts that raised the money supply, stimulating the economy, while also creating record levels of inflation. The federal funds rate rose to its highest level in history during the 1980s. The United States was heading towards record levels of inflation with CPI being over 14% and core CPI being above 13%. To combat the rising interest rates, the Fed set their target rate to 14% in January of 1980. Shortly after, raising the target rate to the highest it has ever been, just under 20%. Due to the increase, the cost to borrow also went through the roof, as 30-year fixed-rate mortgages hit nearly 20% for a short period of time. There are similarities between The Great Inflation and now. In October 1981, there was a 5% increase on mortgage rates YoY, while November of 2022 saw a 4.1% increase YoY. Home sales dropped over 20% in 1980, not unlike the trend seen in 2022. Leading up to this inflationary period, the Fed held rates around 5%, the common target rate also seen today, while CPI hovered between 5-6.5%. Between 1978 and May 1980, there were several rate hikes put into effect by the Fed, raising rates from 6.5% to 20%. The quick and steady increase of rates was needed to reestablish price stability within the US economy with an inflation rate over 12%. From September 1981 to September 1983, inflation dropped 8% but bounced around throughout the rest of the decade. Interest rates were ultimately lowered to 3% in the early 90s through a long series of rate cuts by the Fed.
The Dot Com Bubble (Late 1990s-2002)
A period of long economic growth in the 90s followed the Great Inflation. The Fed was able to reduce interest rates and keep them stable to promote economic growth and create huge levels of growth in the stock market. The Dot Com bubble was an overvaluation of internet-based companies, causing a large influx of investments into lower quality companies. The economic loosening of the Fed mixed with the overpricing of these assets caused the Nasdaq 100 index to increase over 500% from 1995-2000. Interest rates rose slightly during this time from 5% to 6.5%. Following the bubble burst, the Fed dropped interest rates from 6% to 1% in hopes of stimulating a stock market that saw some of its indices lose over 70% of their value. CPI data rose slightly during the build-up of the bubble but declined steadily after, settling in around the Fed’s goal of 2%. The dot-com recession lasted from March to November 2001, but the Fed was initially worried that the economic recovery was lacking as measures of consumer confidence continued to drop till early 2003. The 9/11 terrorist attacks also added to the continued negative outlook, causing more rate cuts due to geopolitical tensions. By mid-2003, inflation was extremely low—core PCE was at 1.78% in January and bottomed out at 1.3% towards the end of 2003.
The Great Recession (2008-2015)
The mid-2000s were a recovery phase for the United States economy, the stock market slowly recovered, mortgage rates came down, and Core CPI remained between 2-3%. During this recovery period, the Fed systematically raised rates 17 times between 2004 and 2006, each time by 25 basis points, from 1.25% to 5.25%. The rate increases were designed to tame the bubbling housing market that ultimately came to a head at the end of 2007. The Fed quickly tried to cut rates in the last quarter of 2007, with the funds rate ultimately reaching near-0% in December 2008. The recession caused CPI data to experience a short deflation period as parts of the stock market lost over 50% of their value in the span of 18 months. Consumer sentiment in the middle of 2008 was extremely low and comparable to feelings had in mid-2022 during the bear market. Crude oil at the start of the recession cost over $140 a barrel, dropping to $70 by the end of the recession. This price movement is also very similar to what was experienced during the bear market, inflationary period in 2022. With low rates and disinflation periods, unemployment doubled to over 10% causing one of the most widely felt recessions in quite some time.
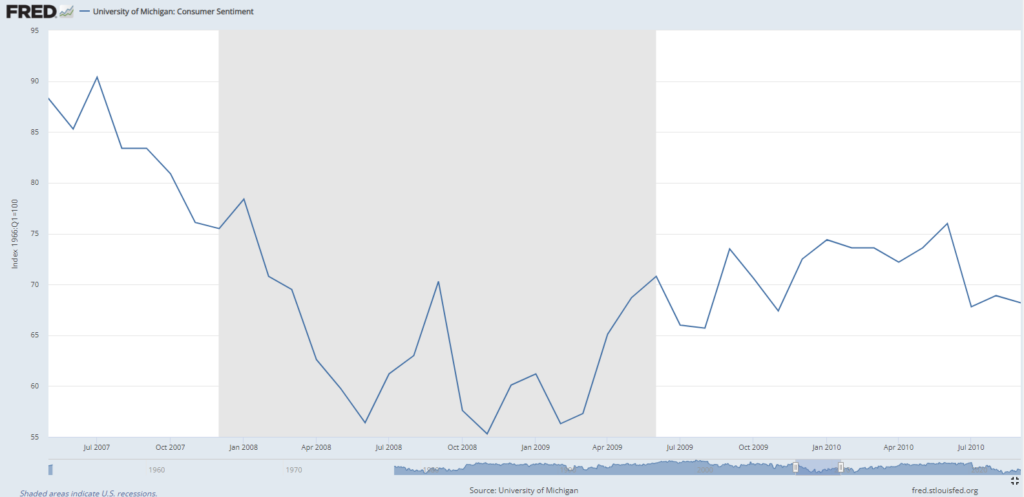
Source: FRED. Shaded in portion of the graph is designated as the Great Recession.
COVID Pandemic (2020-2022)
After leaving rates near-zero, the Fed slowly raised their target rate throughout the mid-to-late 2010s. Core PCE inflation was 1.1% in December 2015, well below the Fed’s target of 2%. It would slowly rise as the Fed raised rates, reaching its target level in March of 2018. Following conflicts stemming from a trade war with China, the Fed cut rates a total of 0.75% during the end of 2019 to mitigate any negative geopolitical catalysts. The COVID-19 pandemic struck early in 2020 and immediately shut down the globe. Production, trade, employment, and markets plummeted as public safety and recovery came to the forefront. The Federal Reserve dropped rates to zero and congress introduced stimulus packages to help a declining economy. The stock market and consumers responded well as the market climbed throughout the remainder of 2020 and into 2021. While the economy was growing again by May 2020, marking the shortest recession on record, the fallout from the economic measures to cope with the COVID pandemic are still being felt. Supply chain issues, a shortage of labor, and low rates with a large influx of cash being injected into the economy raised CPI to its highest levels since the Great Inflation in the 1980s . In turn with this the Fed began raising rates in March 2022, with the last raise coming in August 2023. These rate hikes have been able to wrangle inflation as the October 2023 CPI data came back at 3.2%, down from the almost 9% inflation seen in mid-2022. Consumer sentiment is slowly on the rise from its lowest level since 1980 as economic data continues to show recovery from the fallout of the COVID pandemic.
Post Pandemic and the Now
As we enter a period post pandemic, consumers and businesses budgets are feeling the heat of higher borrowing costs, easing but higher inflation, and resumption of student loans repayments. Each central bank around the world is continuing to evaluate data and current policies to define their policies moving forward. During the pandemic we saw globalization trends regress a bit with global supply chain issues coming to the forefront. While many of the world’s activities have resumed, such as travel and discretionary spending, we have seen dramatic volatility of demand worldwide impacted by inflation and interest rates. Moving forward, the economic outlook, spending and hiring will continue to ebb and flow with the variation of inflation and interest rates.
Inflation, Interest Rates and Your Individual Financial Plan
Having a successful financial plan, along with a well-diversified portfolio puts you in a better position to weather the storm in volatile environments. Long-term financial success is driven by an accurate financial evaluation that successfully manages cash flows and future expenses, accounting for inflation. Your advisory team is here to review and modify your financial plan to adjust for economic circumstances while offering you peace of mind. Continually reviewing items like your debt/interest rates, income projections and asset allocation are paramount to a successful long-term plan.
** The information provided should not be interpreted as a recommendation, no aspects of your individual financial situation were considered. Always consult a financial professional before implementing any strategies derived from the information above.