


A Brief History of U.S. Recessions
Andrea Taylor, CPA, MSA, Wealth Management Associate Advisor | Brent Armstrong, CFP®, Wealth Management Advisor, Partner | October 27, 2022
 As we emerge from the pandemic, there’s a lot on everyone’s mind- unrelenting health concerns, an upcoming election, escalations on the war in Ukraine, and the highest inflation the US has seen in 40 years. So, it comes as no surprise to us here at Weatherly that our most common client dialog these days begins with “When is the next recession?” And despite Weatherly’s in office crystal ball, we are balancing a historic level of uncertainty and volatility. Therefore, we wanted to take a look at current economic conditions through the lens of past recessions. By putting historical volatility in context, we hope to add perspective on current market uncertainty.
What is a Recession?
A recession is a slowdown or contraction of the economy over a business cycle and is often defined as two consecutive quarters of negative gross domestic product, or GDP. However, in the US we have the National Bureau of Economic Research (NBER), who ultimately makes recession related determinations. NBER has expanded the definition of recession beyond GDP to capture a range of indicators such as real personal income, employment, personal consumption spending, wholesale-retail sales, and industrial production.
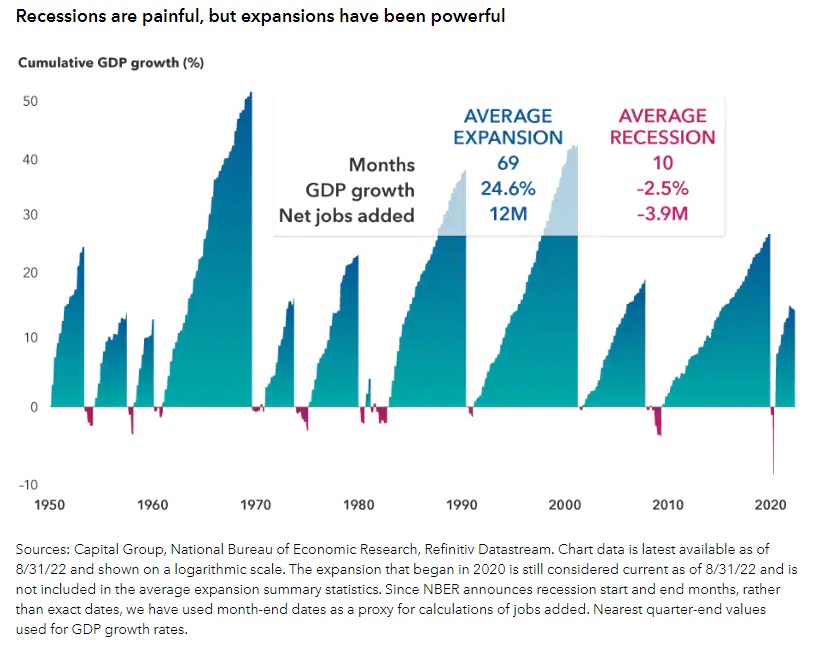
Since the Great Depression of the early 1930s, there have been 14 US recessions. An important observation is that historical recessions are relatively small blips in economic history and are relatively short lived. Over the last 100 years- the average recession has lasted 14 months, while the average expansion was 47 months (JP Morgan’s Guide to the Markets). Similarly, their net economic impact is comparatively small. The average expansion increased GDP by almost 25%, whereas the average recession reduced economic output by 2.5%. All to say, recessions are painful but subsequent recovery can be powerful. For investors with a long-term outlook, recessions can be viewed as an opportunity to deploy capital into assets at a discount.
The Great Depression (1929-1933)
In the 1920s, America bounced back from the disruptions and destruction of World War I. The US economy thrived and Americans dove headfirst into their favorite, newfound wealth generating system – the New York Stock Exchange. During the Roaring Twenties, investors watched the ticker tape and leveraged their bets with historically high levels of margin to trade. Eventually, spending escalated and fueled an unprecedented increase in security pricing which caused assets to be dramatically overvalued. On October 29th, 1929, the bubble burst when the stock market crashed on Black Tuesday- beginning a period of economic contagion now considered to be the biggest recession in US History.
Chart Sourced From: https://www.capitalgroup.com/advisor/insights/articles/guide-to-recessions.html
It’s not easy, even for people who have lived through the economic downturn caused by the COVID-19 pandemic, to grasp the depths of deprivation to which the economy sank during the Great Depression. GDP fell 26.7% and in 1933, unemployment reached a striking 25.6%. The Great Depression triggered a series of economic regulation and reform that revolutionized US financial markets. After Black Tuesday and the collapse of more than 1/5th of American banks by 1933, strict trading and bank regulations were put in place. These updated financial protections were enforced by the newly formed Securities and Exchange Commission (SEC) and the Federal Deposit Insurance Corporation (FDIC). FDR’s New Deal also expanded the role of the government and introduced an array of services, regulations, and subsidiaries to address the high rates of unemployment and poverty.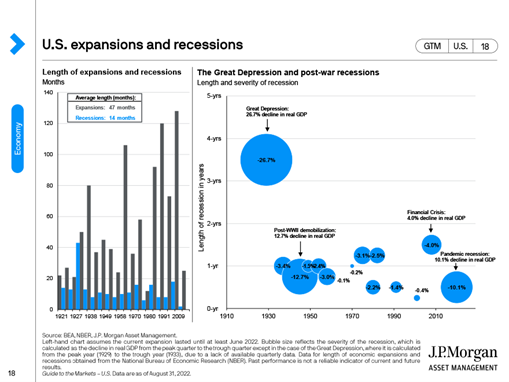
The Roosevelt Recession (May 1937 – June 1938)
The Roosevelt Recession pales in comparison to the Great Depression, despite being one of the worst recessions of the 20th century. Sometimes referred to as “the recession within the Depression”, it came before the Great Depression’s recovery was complete. Real GDP fell 11% and industrial production fell 32%, which was widely attributed to a tightening of fiscal and monetary policy related to the New Deal. (Refer to Weatherly’s A Presidential Look at U.S. Taxes for more information) It isn’t until after this recession, in 1939, that the United States economy is thought to have fully recovered from the Great Depression.
Chart Sourced From (Page 18): https://am.jpmorgan.com/us/en/asset-management/adv/insights/market-insights/guide-to-the-markets/
The Union Recession (February – October 1945)
As the US entered the sixth and final year of World War II, a decline in government spending led to a drop in GDP. The Union Recession was the result of subsequent demobilization and a general shift from wartime to peacetime. This recession got its name from the large increase in union related work stoppages at the time, which directly translated to a decrease in production and subsequent economic output. Contrary to the prognostication of economists at the time, this recession was much slower and shallower than predicted – perhaps due to the conditioned expectations of previous recessions.
The Post-War Recession (November 1948 – October 1949)
Similarly, the Post-War Recession was relatively short- lasting eight months from peak to trough. This recession proved to economists that the US had successfully adapted to the post-World War conditions. In late 1949, another robust expansionary period began that lasted 45 months with 6.9% annual GDP growth.
The Post-Korean War Recession (July 1953 – May 1954)
The Post-Korean War Recession ultimately occurred due to the high level of war related expenditures in the US and subsequent inflationary pressures. During this time, the inflation rate in the US soared from its pre-war 2% to a staggering 10%. To curb inflation, the Fed tightened money supply and the cost of borrowing. Relatively speaking, this was a brief recession- lasting only 10 months from peak to trough.
The Eisenhower Recession (August 1957 – April 1958)
In early 1957, a large influenza outbreak in Asia began to spread to Europe and then the United States by late summer. “The Asian Flu” reduced labor supply and slowed production at the same time the Federal Reserve was tightening interest rates to fight inflation. This stagnated the housing sector and auto sales plummeted. A moderate recession with a wide reach, growth restarted only 8 months later after the Eisenhower administration implemented various stimulus measures. The Federal reserve also pivoted to lower rates to 1.75%.
The “Rolling Adjustment” Recession (April 1960 – February 1961)
A “rolling adjustment” recession occurs when a slowdown in one economic sector has a pervasive effect on the entire economy. This recession occurred in line with the globalization of the automotive industry and subsequent decrease in domestic auto sales/production. During this 10-month recession, GDP declined 2.4% and unemployment reached nearly 7%. The light at the end of the tunnel was a long expansionary period that lasted nine years from 1961 to 1969. Throughout this time, cumulative GDP almost doubled, with a growth of more than 90%. This was the longest period of economic expansion during the 20th century.
The Nixon Recession (December 1969 – November 1970)
The Nixon Recession followed the lengthy period of expansion. This recession was also relatively short, lasting only 11 months from peak to trough and fairly mild. A more consequential event happened shortly after in 1971 when Nixon eliminated the gold standard. This paved way for floating currencies and the ability of central banks to exhibit more control over their economies through monetary policy. This also contributed to exacerbating the following recession and inflation due to the dollar losing value relative to other currencies.
The Oil Shock Recession (November 1973 – March 1975)
Growth resumed after the brief Nixon Recession for three healthy years. Annual GDP increased by 5.1% and annual employment increased by 3.4% during this time. This expansionary period came to an end abruptly with the 1973 oil crisis. Inflation remained stubbornly high and would soon rise to double digits despite stagnating growth, a phenomenon that came to be known as stagflation. A quadrupling of oil prices by OPEC, coupled with the 1973 stock market crash led to a stagflation recession.
The Energy Crisis I Recession (January – July 1980) and Energy Crisis II Recession (July 1981 – November 1982)
Following the Oil Shock Recession, an expansion occurred for the remainder of the decade. Inflation remained high during this period, peaking around 15% in 1980, and energy prices continued to be a particular sore point. Oil prices reached an all-time high that would not be surpassed until more than 25 years later, in 2008. This expansion was followed by a “double dip” recession. One short recession in 1980, triggered in part by the Federal Reserve’s decision to combat rising prices by raising interest rates, followed by the worst economic downturn in the US since the Great Depression from 1981 to 1982. Unemployment reached nearly 11% and GDP fell by 1.8%.
The Gulf War Recession (July 1990 – March 1991)
After the lengthy peacetime expansion of the 1980s, the Gulf War recession was mild and brief. It lasted just eight months and was a combined result of the Gulf War’s effect on oil prices and the savings and loan crisis. In August of 1990, Iraq invaded its oil-producing neighbor, Kuwait. The ensuing Gulf War created a shortage in oil production and therefore an increase in price per barrel. This, coupled with the state of residential mortgage markets caused the market to go into a recession. By the end of the 1980s, after years of historically low interest rate debt accumulation on residential mortgages, small local banks suffered as the Fed had begun steadily raising interest rates in response to growing inflation.
The Dot Com Recession (March – November 2001)
The 1990’s were the longest period of economic growth in American history up until the Dot Com Bubble. A frenzy of exuberance around the first wave of internet companies coupled with low interest rates came to a head as tech IPOs and stock prices became grossly overvalued. As the name insinuates, this recession began when the stock prices of internet companies crashed as the Fed began raising interest rates in 1999 and 2000. The tech-heavy NASDAQ ended up losing nearly 77% of its value and took over 15 years to recover its losses.
It’s important to distinguish- a stock market crash does not necessarily result in a recession. But on September 11th, 2001, the devastating attack on the World Trade Center solidified a pessimistic outlook that teetered the US economy into a recession
All things considered, the Dot Com Recession lasted 8 months with unemployment reaching 5.5% and GDP falling by 0.95%.
The Great Recession of 2008 (December 2007 – June 2009)
The Great Recession was the longest economic downturn since World War II and was the deepest prior to the COVID-19 Recession. Real GDP fell 8.5% in the fourth quarter of 2008, and unemployment peaked at 10% in October 2009. The Great Recession was triggered by the subprime mortgage crisis and the collapse of the US housing bubble. In the years leading up to the recession, financial institutions created complex securities that bundled bad mortgages and sold them as high-quality investments known as CDOs (Collateralized Debt Obligations). In 2007, major subprime lenders began filing for bankruptcy as borrowers were unable to repay their mortgages, which burst the housing market bubble. Over the next year–and–a–half, stock markets tanked, and major financial firms started going bankrupt, triggering a worldwide financial crisis and a recession.
The effects of the Great Recession of 2007-2009 continued to be felt for years. The Fed cut interest rates to zero in an effort to encourage borrowing. Congress passed two stimulus packages, and later passed the Dodd-Frank Act to tighten financial market regulation and prevent a similar catastrophe in the future.
The COVID-19 Recession (February – April 2020)
The Coronavirus recession was the shortest in US history, lasting just two months, but had the steepest GDP decline since the 1945 recession. More than 24 million people lost their jobs in the US the first three weeks of April 2020. The economic impact of the virus and the ensuing stay at home orders is to still be determined but was quickly propped up by government intervention. The Fed rapidly slashed interest rates to zero, Congress passed stimulus packages that put cash directly into American’s pockets, and PPE loans were extended to small businesses to stay afloat. Amongst the medical, social, and economic crisis- sentiment improved and the recovery from the Covid-19 pandemic was remarkably fast. Real GDP grew 5.6% throughout 2021 and the unemployment rate reached 50-year lows.
Looking Forward
Recessions are a natural and necessary part of every business cycle to remove excess, reprice assets, and tame risky behavior. While recessions have been relatively short and infrequent in comparison to expansions, they must be expected and can be mitigated through proper asset allocation, diversification of asset classes, and emergency funds- to name a few. It is vital to maintain perspective and have a long-term view. Financial plans are an excellent way to test your ability to withstand a large recession and give confidence that your assets are sufficient to meet your goals before, during, and after recessions.
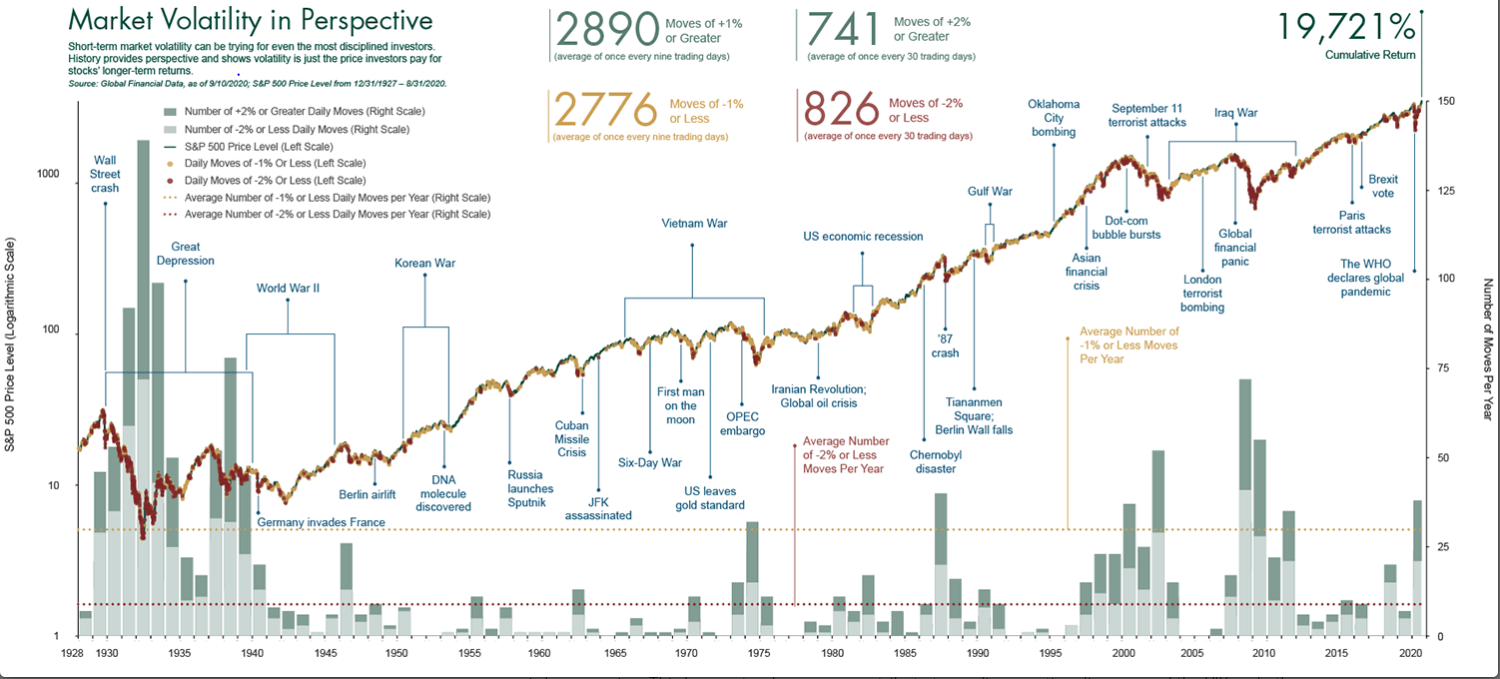
Chart Sourced From: https://www.fisherinvestments.com/en-us/insights/market-cycles/volatility/in-perspective
Further Reading
• Capital Group: Guide to Recessions
• US Economic Recession Timeline
• Net Suite’s History of Economic Recession
• Great Depression
• NYTimes Coronavirus
• Nixon Shock
Charts Sourced From:
• Chart 1: https://www.capitalgroup.com/advisor/insights/articles/guide-to-recessions.html
• Chart 2: https://am.jpmorgan.com/us/en/asset-management/adv/insights/market-insights/guide-to-the-markets/
• Chart 3: https://www.fisherinvestments.com/en-us/insights/market-cycles/volatility/in-perspective
** The information provided should not be interpreted as a recommendation, no aspects of your individual financial situation were considered. Always consult a financial professional before implementing any strategies derived from the information above.